Creating a Google COVID-19 Mobility Dashboard in Tableau

Why take this course?
🚀 Course Headline:
🎓 Creating a Google COVID-19 Mobility Dashboard in Tableau
Master the Art of Data Visualization with Toan Hoang!
🌍 Course Description:
Dive into the world of data visualization with Tableau Desktop, the industry's Gold Standard for turning complex datasets into compelling stories. This course is designed for those who already have a grasp of Tableau's fundamentals and are ready to elevate their data dashboard creation skills. With Toan Hoang's expert guidance, you will learn the nuances of crafting professional-grade dashboards that captivate your audience and convey insights clearly and effectively.
What You'll Learn:
📊 Understanding Data Acquisition:
- Grasp the intricacies of Google Mobility Data.
- Learn to import and explore data with ease.
- Discover how to load this data into Tableau efficiently.
🖥️ Building Worksheets:
- Create dynamic, informative worksheets using icons, colors, and clever duplication techniques.
- Support your insights with essential calculations.
- Enhance your worksheets with creative visualizations that pop!
�ashboard: Assembling the Dashboard:
- Perfect your dashboard with precise formatting using containers for pixel-perfect control.
- Adapt your design for various devices with mobile layouts.
- Utilize parameters to create interactive elements and toggle worksheets seamlessly.
Why This Course?
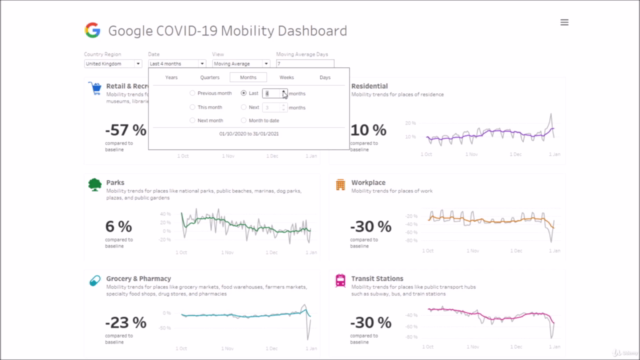
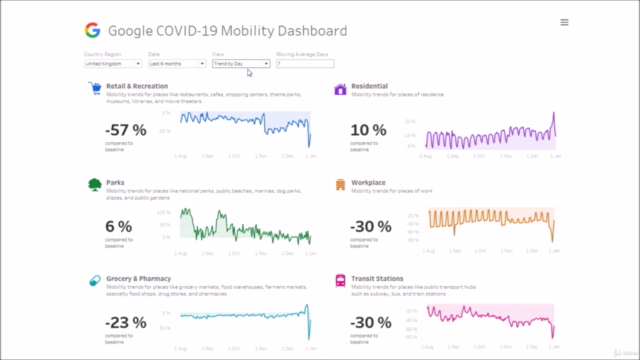
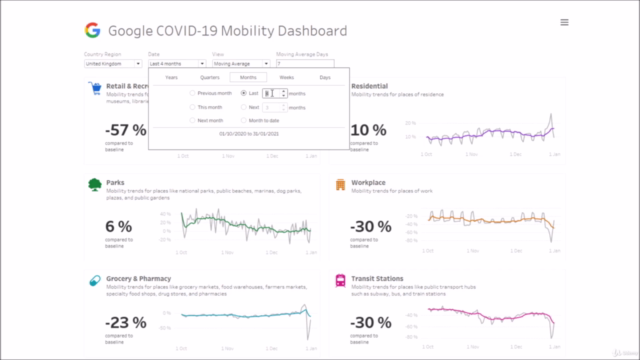
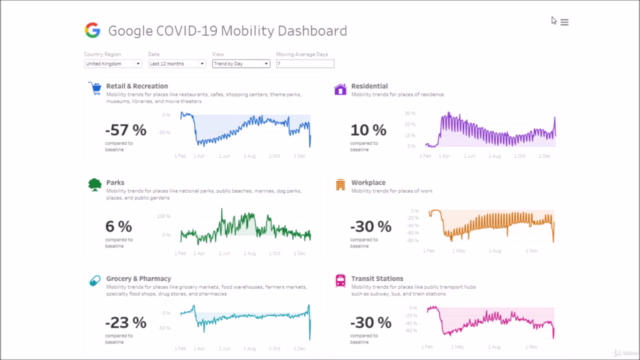
This isn't just about creating a Google COVID-19 Mobility Dashboard; it's about refining your method for constructing impactful dashboards every time. The techniques you'll learn from Toan are universal and will significantly improve the quality of all your visualizations. And as a cherry on top, you'll end up with an impressive Google COVID-19 Mobility Dashboard that showcases your newfound skills! 🎯
🛠️ Course Requirements:
Please note: While this course will guide you through the application of advanced Tableau techniques, it is not intended as a primer on Tableau's fundamentals. A solid understanding of Tableau's core features and functions is necessary to get the most out of this experience.
📆 Key Topics:
-
Data Acquisition 📊
- Understanding Google Mobility Data
- Importing and exploring data in Tableau
- Efficiently loading data for analysis
-
Building Our Worksheets 🖌️
- Creating individual worksheets with impact
- Utilizing icons, colors, and calculations effectively
- Enhancing your worksheet toolkit with duplication and visual tricks
-
Assembling the Dashboard 🎨
- Employing containers for pixel-perfect precision
- Designing mobile layouts for versatility
- Interactive toggles using parameters for a seamless user experience
📅 Enroll Now to Transform Your Data into Insightful Stories with Toan Hoang!
Don't miss this opportunity to elevate your data visualization skills. Join us and turn your data into a masterpiece that communicates with clarity and style. Sign up for "Creating a Google COVID-19 Mobility Dashboard in Tableau" today and begin your journey towards creating dashboards that truly make an impact! 🌟
Course Gallery


Loading charts...