Microsoft Excel - Basic Data Visualization in Excel

Why take this course?
🌟 Microsoft Excel - Basic Data Visualization in Excel 🌟
Welcome to the Course!
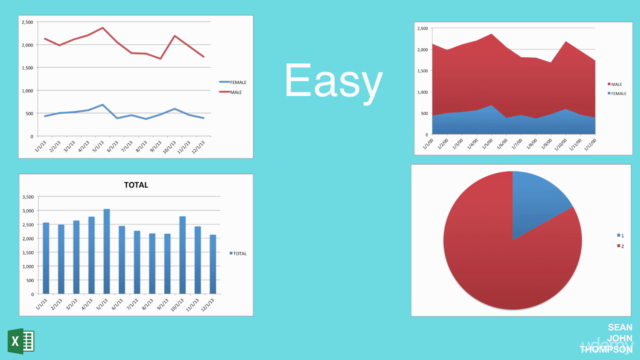
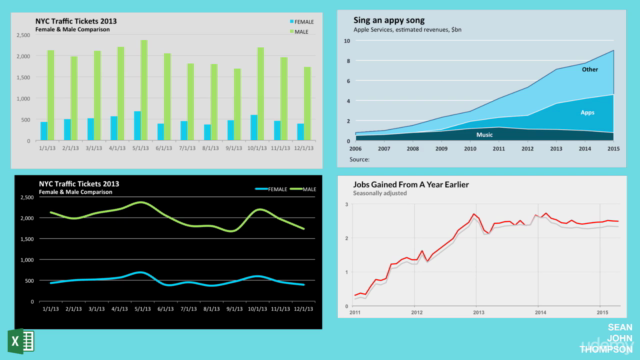
Learn how to make great data visualizations in Excel – Dive into the world of data representation with our comprehensive course, designed to elevate your Excel skills from ordinary to extraordinary. Say goodbye to uninspiring default graphs and hello to personalized, impactful visualizations that capture the essence of your data!
Course Overview
Welcome to our engaging course where you will learn to master the basics of data visualization in Excel. This isn't just about creating charts; it's about understanding how to present data in a way that tells a story, persuades, and informs your audience. Here's what you can expect:
- Determining Data Suitability: Learn when your data is ready for visualization and which types of charts are most effective for your needs.
- Data Organization: Discover the importance of organizing data efficiently before graphing, saving you time and enhancing the accuracy of your visualizations.
- Enhancing Datasets with VLookups: Gain the ability to refine your datasets using powerful Excel functions like vlookups, ensuring that your graphs represent the most relevant information.
- Customizing Graphs for Your Audience: Tailor your graphs to resonate with your target audience by understanding their perspective and expectations.
- Utilizing Visualizations Beyond Excel: Learn how to apply your newly acquired skills outside of Excel, making your data insights versatile and adaptable across different platforms.
- Surprise Tips & Tricks: Uncover some of the lesser-known features within Excel that will make your graphs stand out from the crowd.
Course Format
Our course is primarily video-based, providing a visual learning experience that makes complex concepts clear and easy to understand. Each video is accompanied by downloadable Excel spreadsheets, which serve as both a guide during the lesson and a valuable resource for future reference.
Skill Enhancement & Practical Application
This course is meticulously crafted to build upon your existing Excel skills. It's designed with real-world application in mind, ensuring that you can implement what you learn immediately and effectively. Whether you're presenting to investors or conveying insights to a team, the skills acquired here will make a tangible difference.
Your Learning Journey
As you progress through this course, you'll find that each lesson is carefully structured to enhance your understanding of data visualization in Excel. My goal is for you to finish this course not just as an experienced user of Excel, but as a confident data communicator who can wow your boss and colleagues with your newfound skills.
Final Thoughts
I'm excited for you to embark on this journey to become an Excel data visualization expert! I've designed this course with the student experience at its core, ensuring that each lesson is informative, practical, and enjoyable. I hope you not only enjoy the process of learning but also find joy in the new possibilities that these skills open up for your career.
- Sean John Thompson 📊
Let's get started on this exciting adventure into the realm of data visualization with Excel! 🚀
Course Gallery


Loading charts...