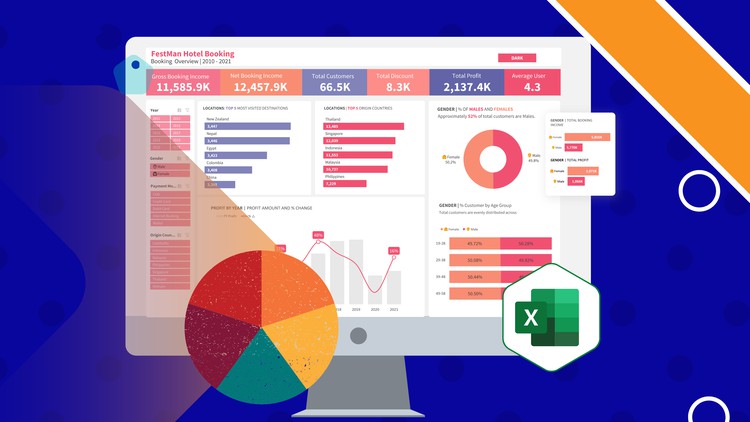
Create rich and interactive Dashboard using Microsoft Excel.

Why take this course?
🚀 Course Title: Create Rich and Interactive Dashboards using Microsoft Excel
🎓 Course Headline: Learn how to build a fully interactive and self-service business intelligence dashboard using Microsoft Excel!
Unlock the Power of Data with Microsoft Excel:
Data visualization and Dashboard design skills are invaluable in today's data-driven world. A well-designed dashboard can transform complex data into actionable insights, providing a quick and efficient way to monitor performance across key business metrics.
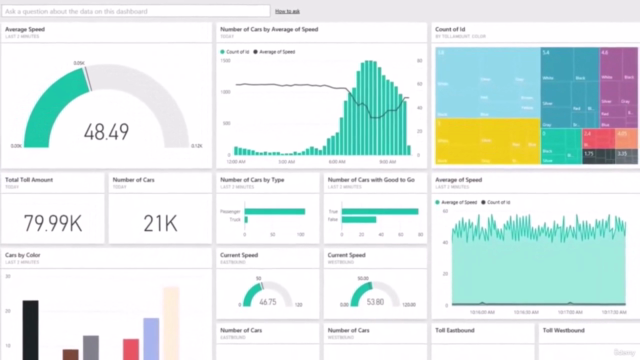
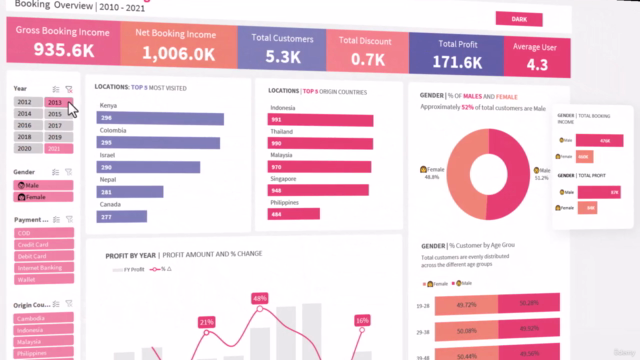
🔍 What is a Dashboard? A dashboard is more than just a report; it's a visual tool that allows users to quickly view and analyze data in one place. It serves as a self-service business intelligence (BI) portal, enabling users to explore data and uncover insights on their own.
🎯 Why Learn Microsoft Excel for Dashboards? Microsoft Excel is a versatile tool that can be used to develop rich, interactive dashboards and reports. With its advanced features, you can automate processes and provide real-time data visualizations that drive decision-making in your organization.
🛠️ What You'll Learn:
- How to analyze and visualize data effectively using Microsoft Excel.
- Techniques to design interactive dashboards that engage users and stakeholders.
- Strategies for automating reports to save time and reduce errors.
🔑 Who Should Take This Course? This course is perfect for:
- Data analysts who want to elevate their reporting capabilities.
- Business professionals who rely on data to make strategic decisions.
- Anyone looking to enhance their data presentation skills for a competitive edge in the job market.
📈 Hands-On Learning Experience: We believe in a guided learning approach, where you'll get hands-on experience with real-world scenarios, ensuring you can confidently apply what you learn to your own business challenges.
🌟 Course Highlights:
- Comprehensive instruction on building interactive dashboards from scratch.
- Step-by-step guidance through the use of advanced Excel functions and features.
- Real-time examples and exercises that mirror real-world BI dashboard requirements.
- Tips and best practices for effective data visualization and dashboard design.
🚀 Elevate Your Career with Excel Dashboards: By mastering the art of creating dynamic dashboards in Microsoft Excel, you'll position yourself as a valuable asset to any organization. This skill will not only enhance your current role but also open up new career opportunities.
📅 *Enroll Now and Transform Your Data into Stories! Embark on your journey to becoming a data visualization expert today and learn how to craft compelling, interactive dashboards that drive actionable insights! 🌟
Spaces are limited - secure your spot now and take the first step towards mastering Microsoft Excel for Business Intelligence!
Course Gallery


Loading charts...