Create High Quality Infographics in PowerPoint

Why take this course?
🎓 Create High-Quality Infographics in PowerPoint 🚀
Course Headline:
Master the Art of Visual Storytelling with 20 Effective & Successful Infographics from Scratch in PowerPoint!
Course Description:
Infographics are more than just a pretty picture; they're a compelling way to communicate complex information and data in an easy-to-digest format. They can be the difference between your audience glazing over or absorbing and acting upon what you have to say. 🚀 "Create High-Quality Infographics in PowerPoint" course is designed for anyone looking to craft visually stunning, informative infographics using only the tools available within PowerPoint.
🔹 Key Elements of Effective Infographics:
- Define Your Goal: Know what you want your infographic to achieve or convey.
- Gather Data: Collect the information that will support your message.
- Simplify Your Message: Use clear and concise language to make your content easily digestible.
- Keep It Simple: Ensure that the design does not overpower the message, making it simple for viewers to understand.
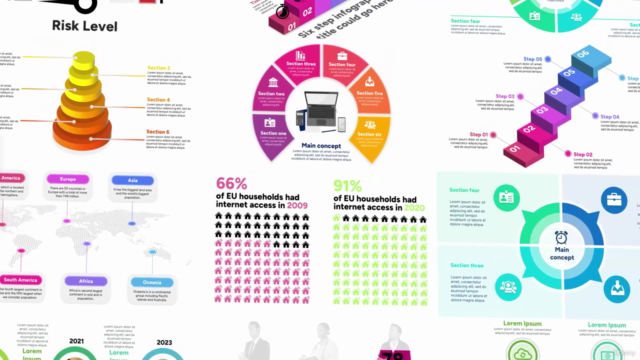
In this course, you'll discover how to create 20 different types of infographics, covering a wide range of common designs and scenarios where they can be applied. 📊
Key Topics We'll Cover:
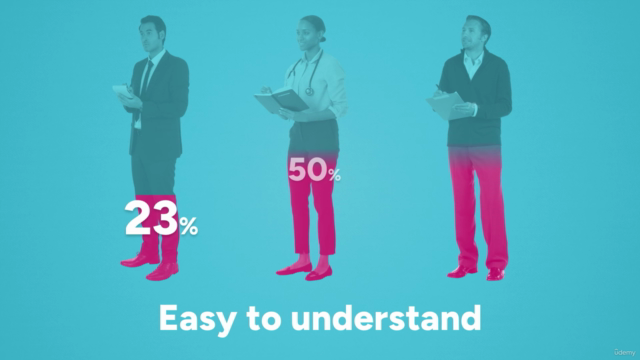
- Designing Visually Appealing & Easy-to-Understand Infographics
- Visualizing Your Data with Simplistic Infographics
- Leveraging Effective Typography and Color Schemes
- Creating Impactful Designs from Scratch in PowerPoint
Course Highlights:
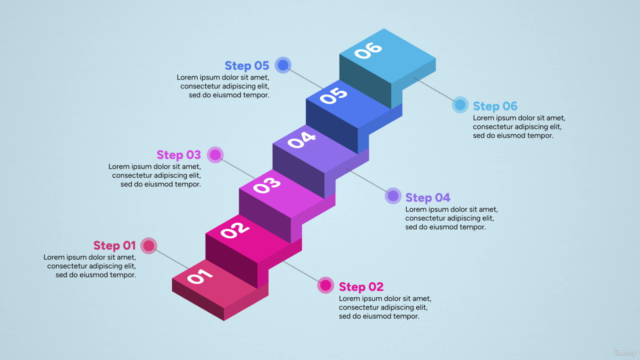
- 👩💼 Real-World Examples: From converting pie charts to circular infographics, to using standard shapes for 3D isometric layouts, each lesson is packed with practical examples.
- 🎨 Custom Shapes and Complex Designs: Learn how to create custom shapes and add depth to your designs.
- ⏳ Designing Timelines: Discover how to make timelines from scratch that are both visually appealing and informative.
- 🌍 Utilizing Photos & Vector Shapes: Find out how to effectively incorporate photos and vector shapes into your infographics.
- 📍 PowerPoint Maps: Make the most of PowerPoint's mapping features to add location-based elements to your designs.
- ✏️ Incorporating Icons & Vector Shapes: Master the use of icons and vector shapes to enhance your infographics and make them pop.
About Your Instructor:
Hello there! My name is Alan, a seasoned presentation designer with over 20 years of experience under my belt. I've been honing my skills in PowerPoint for decades and have seen the power of well-crafted infographics firsthand. I'm here to guide you through the process of creating your own high-quality infographics from scratch using only PowerPoint's standard shapes, text, and imagery.
By the end of this course, you'll have the tools and knowledge to design impactful infographics that can captivate any audience. Whether for business presentations, social media posts, or educational materials, the skills you learn here will be invaluable.
So, are you ready to unlock the power of infographics? Let's get started on this visual adventure! 🌟
If you have any questions or need clarification along the way, don't hesitate to reach out. I'm here to assist you every step of the way. Let's transform your data into a story that can be seen and understood at a glance. Enroll now and embark on your journey to becoming an infographic master with PowerPoint! 🚀
Course Gallery


Loading charts...