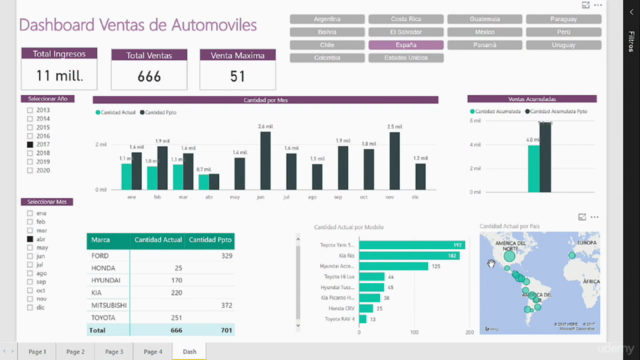
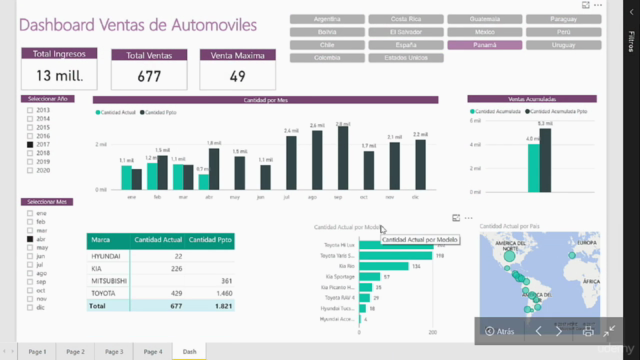
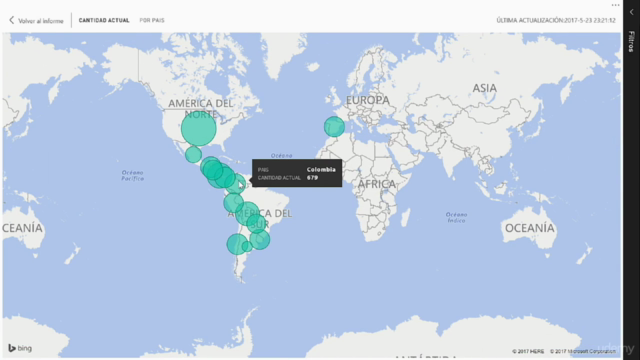
Análisis y Visualización de Datos con Power BI

Why take this course?
📊 **Transform your Data Skills with Análisis y Visualización de Datos con Power BI 🎓
Course Description:
Are you ready to dive into the world of data analysis and visualization with a tool that's revolutionizing how businesses interact with their information? Our comprehensive course, "Análisis y Visualización de Datos con Power BI", is tailored for individuals who are eager to master the art of data modeling, reporting, and dashboard creation using Microsoft Power BI.
Why Choose this Course?
- 🚀 Ease of Use: Power BI's intuitive design with drag-and-drop functionality makes it accessible for all skill levels, enabling you to create stunning reports and visualizations without complex coding.
- 💻 Powerful Data Handling: Learn to handle massive amounts of data with ease, and turn raw figures into actionable insights that can drive business success.
- 🌐 Web and Desktop Accessibility: Not only will you learn to create dashboards, but also how to publish and refresh them online for access at any time.
- 🔄 Career Advancement: Enhance your skills in data reporting and dashboard creation to stay ahead in the competitive field of business intelligence.
- No Additional Costs: Power BI Desktop is a free tool that can be downloaded to your PC, allowing you to start your journey into the realm of data analytics right away.
What You Will Learn:
✅ Getting Started: Learn how to download Power BI Desktop and get set up with Power BI Service for seamless data management. ✅ Exploring Power BI Desktop: Gain hands-on experience in creating tables and reports that will lay the foundation for your data visualization projects. ✅ Data Wrangling: Master the art of data carga, transformación, and filtration to ensure your data is clean and ready for analysis. ✅ Visualization Techniques: Dive into the variety of graphs and visualizations available in Power BI to present your data in the most impactful way. ✅ Data Relationships: Understand how to create complex relationships between datasets to reveal hidden patterns and insights. ✅ Calculations & KPIs: Learn to build powerful calculations, metrics, and KPIs that will help you make informed business decisions. ✅ Interactive Dashboards: Develop dynamic and interactive dashboards that can transform raw data into a story that your stakeholders need to hear.
Course Features:
- 📹 Step-by-Step Learning: Engage with video tutorials that guide you through the process of data modeling, report creation, and dashboard development in a clear and concise manner.
- 📚 Complete Materials: Receive all the materials used throughout the course to ensure you can follow along and apply the techniques demonstrated.
- 🤝 Community Support: Join a community of like-minded learners who are on the same journey as you, offering support and sharing experiences.
Who is this Course for?
This course is designed for anyone working with data and reports, as well as Excel users looking to expand their expertise into the realm of cloud-based intelligence with Power BI. Whether you're a business analyst, a decision-maker, or simply someone interested in learning about data analysis, this course will equip you with the skills needed to enhance your reporting capabilities and understand data trends more deeply.
Embark on your journey towards becoming a data wizard today! 🧙♂️✨
Course Gallery


Loading charts...