Quality Management in Excel- Control Charts
Why take this course?
🚀 Course Title: Quality Management in Excel - Control Charts: Mastering Statistical Process Control for Industry
🎓 Headline: Using and Applying Control Charts in Industry: A Comprehensive Online Course with Real-World Applications
Dive into the World of Data Precision with Control Charts!
Statistics and process control are not just for statisticians anymore. In today's data-driven world, understanding how to apply statistical tools is crucial for professionals across various industries. This course, Quality Management in Excel - Control Charts, is your gateway to mastering these essential skills. It's designed to provide you with a thorough grasp of control charts, which are pivotal for maintaining quality and ensuring efficiency in any operation.
Course Overview:
What You’ll Learn:
- 📊 Fundamentals of Control Charts: Discover the origins and importance of control charts within statistical process control (SPC).
- ✅ Types of Control Charts: Explore different types of control charts, including I, U, P, and more, and understand their specific applications.
- 📚 Real-World Scenarios: Engage with hands-on exercises that demonstrate how to implement control charts in various sectors such as healthcare, manufacturing, software development, and finance.
- 🤔 Strategic Insights: Learn to interpret the data and use insights from control charts to make informed strategic decisions.
Course Structure:
Modules Breakdown:
Module 1: The Pillars of Control Charts
- 🕰️ The History of SPC and Control Charting
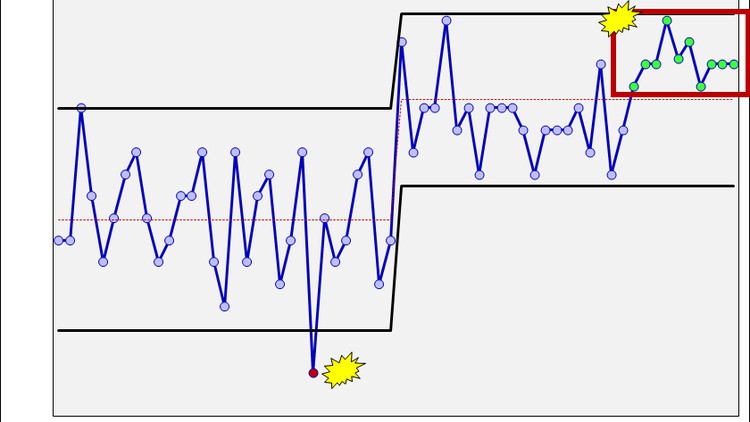
- 📈 Parts of a Control Chart
- ✅ Advantages of Using Control Charts
- 📊 Types of Control Charts
Module 2: The Science Behind Control Charts
- ➿ Key Assumptions in SPC
- 🚫 Identifying Change in Mean Signals
- 🔄 Detecting External Influence Signals
- 📈 Assessing Process Stability/Capability Signals
Module 3: Hands-On with Control Charts
- ⚙️ Building Individual Range Charts
- 📉 Creating Moving Range Charts
- 📊 Constructing P Charts
- 📉 Developing U Charts
Module 4: Applying Control Charts in Different Contexts
- 🏥 Hospital Wait Times Analysis
- 🛠️ Improving Manufacturing Processes
- 💻 Optimizing A/B Testing in Software Development
- ⚗️ Enhancing Inspection Processes
Module 5: Real-World Case Examples
- 🔍 In-Depth Control Chart Case Studies
Why Take This Course?
- 🌍 Industry-Relevant Knowledge: Gain skills that are directly applicable to real-world industry scenarios.
- 🤝 Practical Exercises: Work through hands-on exercises that solidify your understanding of control charts.
- 💡 Expert Instruction: Learn from Michael Parent, an expert instructor with a wealth of knowledge in quality management and Excel.
- 🎓 Certification Opportunity: Upon completion, earn a certificate that showcases your proficiency in control chart application and SPC.
Embark on this journey to become a pro in Quality Management using Control Charts in Excel. Whether you're looking to enhance your current skill set or start a career in quality assurance, this course equips you with the practical knowledge needed to excel. 🌟
Enroll now and take the first step towards becoming an expert in statistical process control! 📈🚀
Course Gallery
Loading charts...