The Complete Tableau Bootcamp for Data Visualization

Why take this course?
🚀 The Complete Tableau Bootcamp for Data Visualization 📊
Master Tableau by Building Worksheets and Creating Professional Dashboards 🎓
Welcome to the definitive online resource for aspiring data visualization experts! "The Complete Tableau Bootcamp for Data Visualization" is your gateway to mastering Tableau Version 10 (2019) and crafting compelling, insightful dashboards. This comprehensive course is designed to take you from a novice to an advanced user, with hands-on projects that will showcase your newfound skills.
What You'll Learn:
-
🛠 Installation and Setup: Get started by installing Tableau Public on your computer, ensuring you have the tools at your fingertips to begin your journey.
-
🌍 Visual Analytics with Tableau: Dive into the fundamentals of data visualization and learn how to transform raw data into understandable stories.
-
📍 Mapping for Geographical Data: Understand how to visualize geographical data, making it easier to interpret patterns and trends.
-
🧮 Basic Calculations: Learn the ins and outs of basic calculations in Tableau, setting a solid foundation for more complex data manipulation.
-
🔢 Table Calculations: Explore advanced calculations that will allow you to uncover deeper insights within your datasets.
-
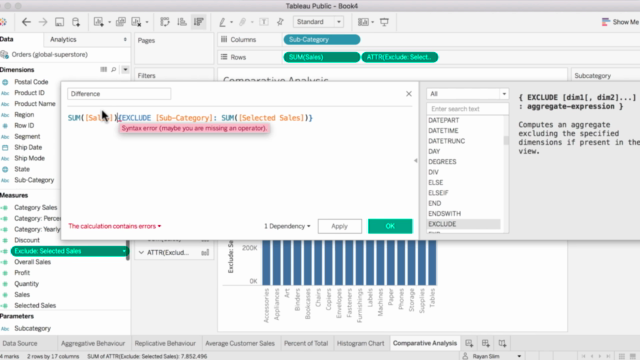
🧬 Level of Detail (LOD) Expressions: Master LOD expressions to solve complex aggregation challenges in your data.
-
✨ Joins and Unions: Combine data from different sources and create meaningful visualizations that can answer real-world questions.
-
👁️♂️ Interactive Worksheets: Create interactive worksheets using Set Actions and Parameter Control, making your visualizations come alive with user interaction.
-
🌐 Spatial Mapping: Leverage spatial data to create detailed, geographically accurate visualizations.
-
👀 Understanding Color Vision Deficiency: Ensure your visualizations are accessible to everyone by learning about color vision deficiency and how it affects data interpretation.
-
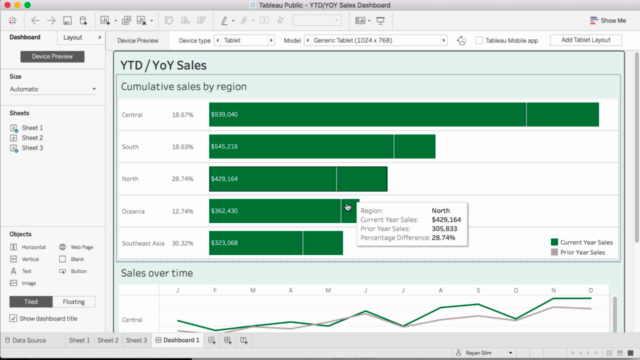
🎨 Build Sophisticated Dashboards: Learn the art of dashboard design, creating not just a display of information, but a story that communicates clearly and effectively.
-
...and much, much more!
Course Features:
-
🤝 Access to a vibrant Question and Answer Forum, where you can connect with fellow students and experts, get help, share insights, and build your professional network.
-
⏰ Flexible Learning: Study at your own pace, from the comfort of your home or on the go.
-
🎠 Portfolio of Projects: Build a portfolio of projects that will demonstrate your proficiency with Tableau to potential employers or clients.
-
🏆 Certification: Upon completion, receive a certification that you can proudly display on your LinkedIn profile or resume.
Why Enroll Today?
-
Expert Instructors: Learn from the best in the industry who bring years of experience to the course content.
-
Real-World Data Sets: Practice with real-world data sets that will prepare you for a variety of professional scenarios.
-
Engaging Content: Interactive modules and hands-on projects make learning both effective and enjoyable.
-
Money-Back Guarantee: We're so confident in the quality of our course that we offer a 30-day money back guarantee. Enroll risk-free today!
Join us on this transformative data visualization journey with "The Complete Tableau Bootcamp for Data Visualization". Unlock the full potential of your data and set yourself apart in the world of analytics. Let's turn data into actionable insights together! 📈✨
Course Gallery


Loading charts...
Comidoc Review
Our Verdict
"The Complete Tableau Bootcamp for Data Visualization" offers a variety of strong points to help learners excel in their data visualization journey. While there is room for improvement related to clarity and course structure alignment with beginner needs, the inclusion of practical assignments, helpful tips, and comprehensive coverage of Tableau features make it a worthwhile investment for those seeking an in-depth understanding of this powerful tool.\n\n Course-specific keywords: Tableau, data visualization, Level of Detail (LOD) expressions, Unions and Joins, practical assignments
What We Liked
- The course provides a comprehensive overview of various Tableau features such as Level of Detail (LOD) expressions, basic calculations, table calculations, mapping functionality, story points and more.
- It includes practical assignments that allow learners to apply their skills and knowledge to real-world scenarios.
- The instructor is competent and delivers the content in a professional manner. The visuals are helpful and expressive, and some lessons include useful tips to make visualizations look great and tell a clear story with data.
- Learners can use datasets provided by the instructor or their own datasets, which adds flexibility to the learning experience.
Potential Drawbacks
- The course structure might be unusual for beginners. Some learners may find it challenging to follow if they are new to Tableau.
- The transitions between basic and complex executions and examples can sometimes be too rapid, requiring rewinding many times.
- Some important sections that could benefit from updates related to the latest version of Tableau, such as Unions and Joins.
- There is room for improvement in terms of making explanations simpler, especially for new users. Certain terminologies and concepts require more depth, such as LOD expressions and INCLUDE, EXCLUDE, FIXED concepts.