Python 3 Pandas, Bokeh, and Seaborn Data Visualization

Why take this course?
🚀 Python 3 Pandas, Bokeh, and Seaborn Data Visualization Masterclass 📊✨
Headline: Unlock the Secrets of Advanced Data Visualization with Python 3!
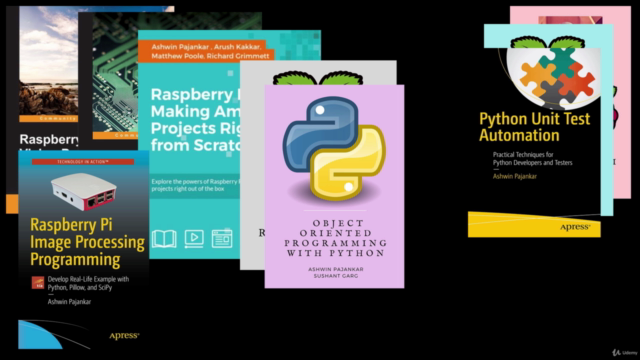
Course Instructor: Ashwin Pajankar | Enlightening over 80,000+ students globally!
What You'll Learn:
- Master Data Visualization Skills: Become proficient in visualizing data with Python 3, a skill highly sought after by employers in the data science and engineering fields. 📈
- Command Advanced Techniques: Elevate your data analysis game with NumPy, Jupyter, Matplotlib, Pandas, Seaborn, and Bokeh – tools that are indispensable for a modern data scientist.
- Earn Top Dollar: With the right skills, data engineers/scientists command salaries upwards of $150,000! 💰
Course Overview: This is the ultimate comprehensive course on advanced data visualization with Python 3 available on Udemy. Whether you're a beginner or looking to refine your expertise in data visualization, this course is tailored for you. 🎓
- No Prior Experience Needed: If you're new to data visualization or have basic knowledge of Python, this course will guide you through every step.
- Hands-On Learning: With over 70 lectures and more than 9 hours of content, we ensure a deep understanding of data visualization concepts through practical application.
- Comprehensive Resources: We provide PDFs and Jupyter Notebooks to aid your learning journey.
Course Structure:
- Getting Started: Learn how to install Python 3, NumPy, matplotlib, and even get your Raspberry Pi up and running with Python 3! 🧙♂️🤖
- Exploring the Scientific Python Ecosystem: Understand the core components of the Python ecosystem that are crucial for data science and analysis.
- Digital Image Processing Basics: Gain insights into image processing to enhance your data representation skills.
- NumPy and Matplotlib: Dive deep into NumPy arrays and master basic visualization with Matplotlib.
- Jupyter Installation and Basics: Get comfortable with Jupyter as your Python workspace for interactive coding and visualizations.
- Advanced Topics Covered:
- NumPy Ndarrays and array creation routines
- Random array generation and bitwise operations
- Statistical functions and data manipulation techniques
- In-depth Matplotlib data visualization recipes
- Seaborn recipes and integration with Pandas
- Explorations with Bokeh for interactive visualizations
- ...and much more to ensure you're fully equipped! 📚
Why This Course?
- Learn at Your Own Pace: Every lecture comes with a full programming video and corresponding Jupyter notebook, so you can learn visually or by coding along.
- Career Advancement: Acquire the skills that will set you apart in the job market and enhance your career prospects.
- Lifetime Access: Get lifetime access to over 70 lectures, along with PDFs and Jupyter notebooks for hands-on practice! 🤝
Enroll Now and Transform Your Data Visualization Skills! Don't wait to elevate your career – dive into the world of advanced data visualization with Python 3 today. Let's make data come alive with stunning, insightful visualizations that tell a story all their own. 🌟
Enroll in this course and start your journey towards becoming a data visualization expert with Python 3! 🎉
Course Gallery


Loading charts...