2025 Data Visualization in Python Masterclass for Beginners

Why take this course?
🌟 2024 Data Visualization in Python Masterclass for Beginners 📊
Course Headline:
Visualisation in matplotlib, Seaborn, Plotly & Cufflinks, EDA on Boston Housing, Titanic, IPL, FIFA, Covid-19 Data.
Course Description:
Are you ready to embark on a transformative journey into the world of Data Science? 🚀 With KGP Talkie's "2024 Data Visualization in Python Masterclass for Beginners," you don't just learn—you dive deep into the fascinating realm of data analysis and visualization using Python!
Why This Course?
- Trending Career: Data Scientist is a hot profession, with Glassdoor ranking it as the number one job and an average salary of over $110,000 according to Indeed. 💰
- Comprehensive Learning: This course covers everything from basic programming in Python to advanced data visualization techniques. It's like a Data Science bootcamp but at a fraction of the cost!
- Practical Application: With over 200+ Full HD video lectures and detailed code notebooks, you'll have a resource-rich environment to learn from and reference for your future projects. 📚
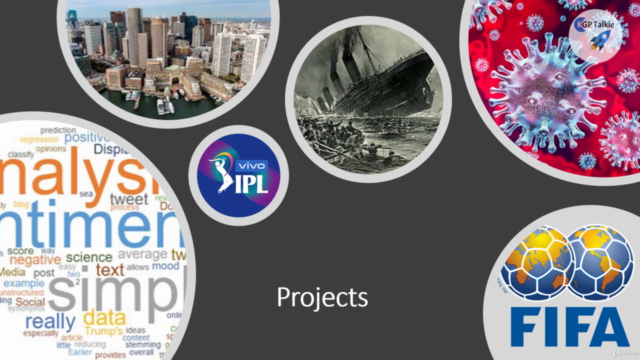
- Real-World Data: Get hands-on experience with real datasets such as Kaggle's Boston Housing, Titanic, Covid-19, IPL Cricket Matches, and FIFA world cup matches. 🏆
Course Highlights:
- Programming Foundations: Learn Python basics to advanced concepts essential for data science.
- Data Manipulation Mastery: Understand how to use NumPy and Pandas to clean, analyze, and manage data effectively.
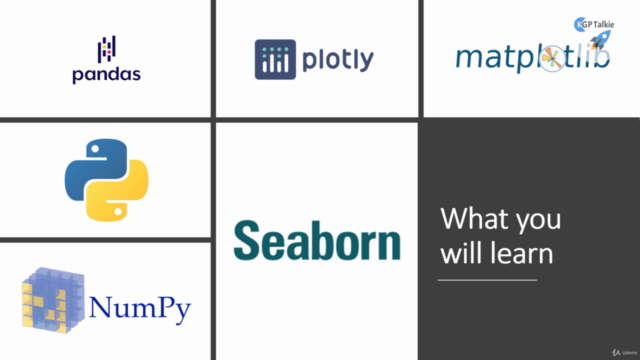
- Data Visualization Techniques: Discover the power of matplotlib, Seaborn, Plotly, and Cufflinks to create stunning visualizations.
- Exploratory Data Analysis (EDA): Perform in-depth analysis on a variety of datasets to uncover meaningful patterns and insights.
- Interactive Visualizations: Learn to create interactive plots that can be used for dashboards, presentations, and reports.
What You Will Learn:
- Python Programming
- NumPy with Python
- DataFrame Operations using Pandas
- Reading Data from Various Sources
- matplotlib & Seaborn for Static Visualizations
- Plotly & Cufflinks for Interactive Dashboards
- EDA on Boston Housing Dataset
- EDA on Titanic Dataset
- EDA on Latest Covid-19 Dataset
- ...and much more! 🎉
Course Benefits:
- Deep Insights: Gain a deeper understanding of how to effectively communicate your data insights using visualizations.
- Skill Enhancement: Master Python libraries specifically designed for data visualization, making it easier to create visualizations in your own projects.
- Practical Experience: Work with real-world datasets and practice creating visualizations to refine your skills.
- Interactive Dashboards: Learn to build interactive visualizations that can be shared with stakeholders.
- Efficient Communication: Create visualizations that convey more information in less space, ensuring your insights are impactful.
Join Laxmi Kant from KGP Talkie and unlock the door to a rewarding career in Data Science! 🗝️ With this Masterclass, you'll be equipped with the tools and knowledge to make a significant impact in the field of data analysis. Enroll now and start your journey towards becoming a data visualization expert!
Course Gallery


Loading charts...
Comidoc Review
Our Verdict
Up-to-date content makes this Data Visualization in Python Masterclass ideal for learners wanting extensive skills. Though some areas could benefit from more clarity, the engaging projects and real-world examples outweigh minor shortcomings. Expand your EDA and visualization competence while preparing to excel in data science roles focused on Python.
What We Liked
- Comprehensive coverage of data visualization techniques using matplotlib, Seaborn, Plotly & Cufflinks
- In-depth exploration of real-world datasets, including Covid-19, Boston Housing, Titanic, IPL, and FIFA
- Hands-on projects and step-by-step instructions for data manipulation using Numpy, Pandas, and text data EDA
Potential Drawbacks
- Occasionally vague explanations of concepts with room for improved structure and predictability
- Advanced Python knowledge is beneficial, making the course less suitable for absolute beginners
- Sporadic errors in provided code snippets can be time-consuming to resolve