Certificate in Data analysis using R programming

Why take this course?
Course Title: Certificate in Data Analysis Using R Programming
Headline: 📊 "A Crash Course for Beginners: Master Data Analysis with R!"
Course Description:
Are you ready to dive into the world of data analysis and unlock the secrets of R programming? Whether you're a complete beginner or looking to solidify your understanding, this comprehensive course is tailored to guide you through every step of the data analysis process. 🎓
Why This Course?
- Essential Skills: From cleaning and manipulating data to summarizing, describing, visualizing, and analyzing it—you'll learn all the essential skills needed for effective data analysis.
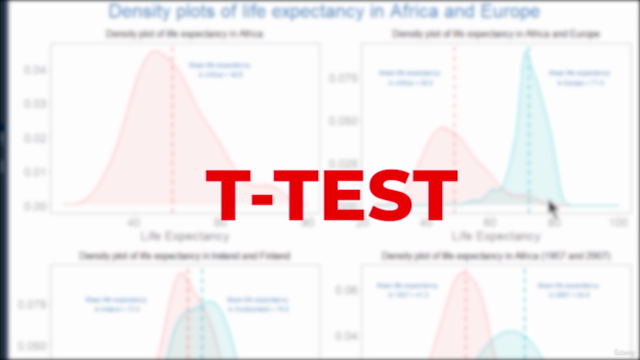
- Statistical Tools: Get hands-on experience with key statistical tests like t-tests, ANOVA, chi-squared tests, and linear regression.
- Real-World Data: Work with datasets that are readily available within R, allowing you to practice each skill directly within the course content.
- Step-by-Step Learning: The complexities of statistics and programming are broken down into digestible, manageable pieces so you can grasp the concepts at your own pace.
Course Highlights:
- Hands-On Approach: Every lesson is crafted with real-world examples that utilize R's built-in datasets—ensuring you can replicate and apply each example.
- Practical Experience: With all the data you need right in R, you can practice and hone your skills without any additional setup or external data sources.
- Understanding & Interpretation: Go beyond just executing code—learn the principles behind hypothesis testing and how to interpret the results of statistical tests.
- Engaging Teaching Methods: Our interactive approach keeps you engaged, motivated, and eager to learn more with each module.
What You'll Learn:
- Data Cleaning Techniques: Learn how to handle missing values, outliers, and other data inconsistencies.
- Data Manipulation: Master the art of manipulating your data for efficient analysis using R.
- Effective Data Summarization: Understand how to summarize data to extract key insights.
- Descriptive Statistics: Dive into measures of central tendency and variability that are critical for understanding your dataset.
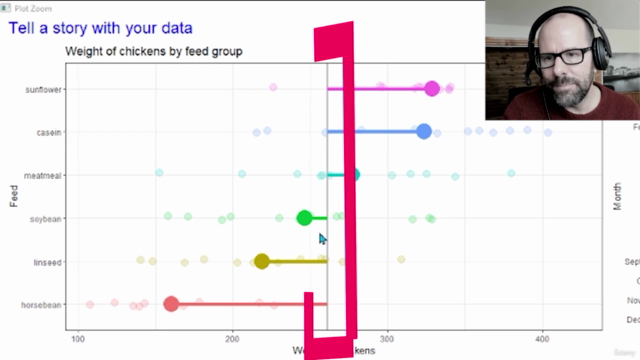
- Informative Visualizations: Create compelling graphs and plots that effectively communicate your findings.
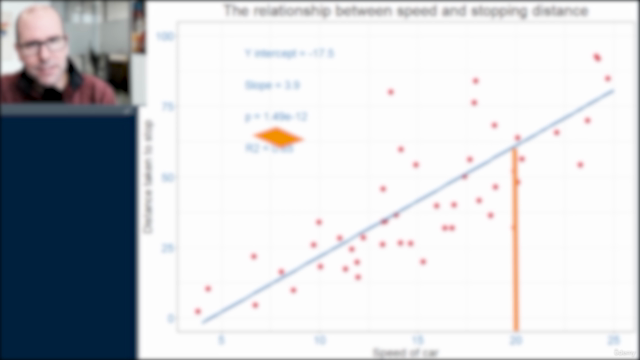
- Statistical Analysis Tools: Perform t-tests, ANOVA, chi-squared tests, and linear regression to uncover relationships in your data.
By the End of This Course:
- You'll confidently navigate R programming with a focus on data analysis.
- You'll be able to analyze complex datasets and extract meaningful insights.
- You'll have a solid understanding of when and how to use statistical tests appropriately.
- You'll be equipped with the tools to interpret and communicate your findings effectively.
Ready to Embark on Your Data Analysis Journey? 🚀
Join us in this engaging, user-friendly course and transform the way you analyze data with R programming. Sign up today and take the first step towards becoming a data analysis pro! 🌟
Enroll now and start your journey to becoming an expert in data analysis using R programming. Let's make data work for you! 🎉
Course Gallery


Loading charts...