Business Intelligence with Power BI Desktop

Why take this course?
🌟 Course Title: Business Intelligence with Power BI Desktop
🚀 Headline: Master Power BI, Data Analysis, Visualization, and Dashboard Design!
🎉 Description: Are you ready to harness the full power of data and turn it into actionable insights? With Power BI, the premier self-service business intelligence platform, you can transform raw data into compelling visual stories that drive decision-making. Whether you're a seasoned professional or just starting out, our comprehensive guide to Microsoft Power BI Desktop will equip you with the skills to excel in the world of Business Intelligence (BI).
🔍 Why Power BI? Power BI is not just a tool; it's a revolution in data analysis and visualization. It's an essential asset for anyone looking to make data-driven decisions. With its ability to connect to hundreds of data sources, build intricate relational models with ease, and design interactive dashboards from the ground up, Power BI is a game-changer in the BI landscape.
🧠 What You'll Learn:
- Connection and Shaping Data: Learn how to seamlessly connect to various data sources and manipulate data to suit your analysis.
- Table Relationships and Data Model: Gain expertise in creating robust relational models that underpin effective BI solutions.
- Analyzing Data with DAX: Master the proprietary formula language of Power BI, DAX, to perform complex calculations and analysis.
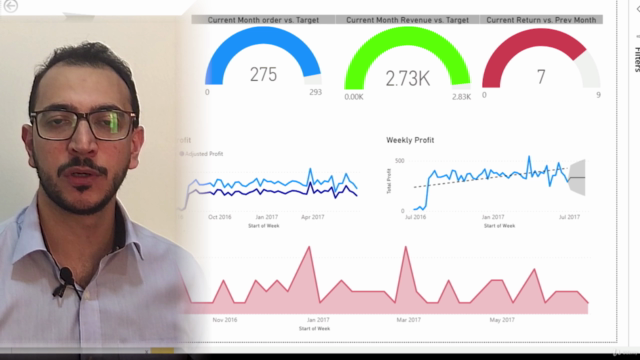
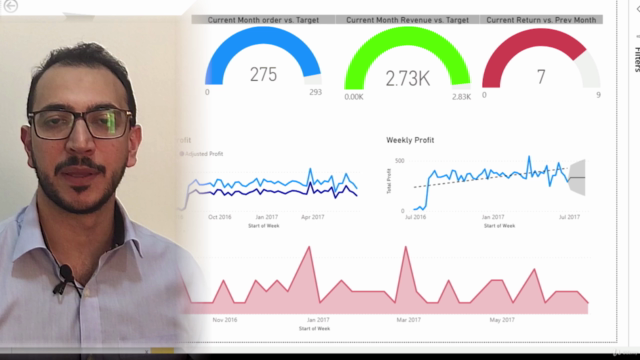
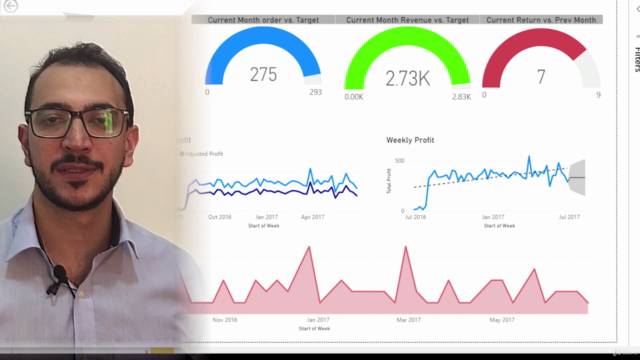
- Data Visualization with Power BI Desktop: Craft visually appealing, interactive dashboards that tell compelling stories about your data.
- Leading Business Intelligence Projects: Act as a Business Intelligence Analyst by designing and delivering professional BI solutions for real-world business cases.
🤝 Your Guide on this Journey: Don't navigate the complexities of Power BI alone! I, Mohannad Alhariri, will be your mentor, guiding you through each project step by step. Together, we'll delve into the nuances of Power BI and ensure you emerge as a confident and skilled Power BI expert.
🛠️ Course Structure:
- Section 1: Introduction to Data Analysis and Power BI Desktop
- Section 2: Connection and Shaping Data
- Section 3: Table Relationships and Data Model
- Section 4: Analyzing Data with DAX
- Section 5: Data Visualization with Power BI Desktop
🎓 Who is this course for? 🚀 Data Analysts: Take your skills to the next level with advanced techniques and real-world applications. 📊 Excel Users: Expand your data modeling, dashboard design, and BI capabilities beyond Excel's limitations. 👩💼👨💼 Business Intelligence Aspirants: Learn the tools of the trade and kickstart your career in data analysis or BI.
📅 Enroll Now! Embark on your journey to mastering Business Intelligence with Power BI Desktop. With hands-on projects, expert guidance, and a comprehensive curriculum, you'll unlock the full potential of your data analysis skills.
👉 Join us and transform your career with the power of data visualization and business intelligence! 👈
Course Gallery


Loading charts...