Microsoft Excel in 90 minutes - Pivot Tables & Data Analysis

Why take this course?
🚀 Master Excel Pivot Tables and Practical Data Analysis with Jeanine A. 📊
Welcome to the World of Advanced Excel!
Microsoft Excel spreadsheets are the bedrock of data organization and analysis in today's business world. As a versatile tool, Excel has carved out its place as an essential program in nearly every industry. 🌟
Why Excel? 🤔
Any professional will tell you that possessing strong Excel skills is a significant asset. It's not just about crunching numbers; it's about unlocking insights and driving informed decision-making across various roles. Whether you're analyzing market trends, managing finances, or optimizing human resources, Excel is your go-to software for clarity and efficiency.
Course Overview:
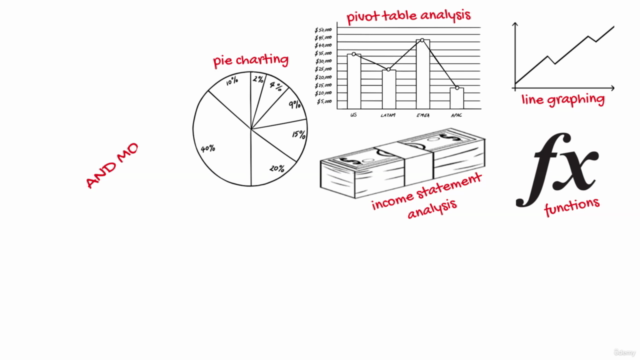
This comprehensive course is designed to elevate your data analysis game by focusing on the powerful features of Excel, particularly the mastery of Pivot Tables. You'll learn how to manipulate datasets, identify trends, and present your findings through engaging visuals. Here's what you can expect:
- Excel Functions & Pivot Tables: Learn to group, slice, calculate, and summarize data to answer complex business questions. 📈
- Pivot Charting & Reporting: Turn your pivot tables into dynamic charts and reports that tell a story with your data.
- Sorting, Filtering, & Grouping: Master these essential tools to organize your data precisely the way you need it.
- Financial Analysis: Dive into creating financial statements, with a special focus on the Income Statement. 💸
- Performance Analysis: Use LOOKUP and COUNTIF functions to analyze employee performance and other key indicators.
- Break-Even Analysis & Cluster Analysis: Understand the basics of financial modeling and data segmentation.
- Data Visualization: Chart, graph, and illustrate your data trends effectively in Excel. 📊✨
Real-World Applications of Excel:
Excel is not just for accountants anymore. Here are some real-world applications that showcase the versatility of Excel:
- Revenue Growth Models: Forecast new product sales and understand market trends. 📈
- Event Planning: Track RSVPs, costs, and logistics for an event like a baseball game. ⚾️
- Editorial Calendars: Organize your website's content schedule in a structured way. 🗞️
- Budgeting & Financial Management: Create budgets, track expenses, and visualize financial performance across categories. 💰
- Customer Discount Strategies: Calculate discounts based on purchase volume and customer loyalty. 🛍️
- Medical Research Analysis: Summarize patient data and contribute to medical advancements. 🩺
- Client Revenue Analysis: Identify key revenue generators and build stronger client relationships. 💼
Take your data management skills to the next level! With Excel, you can turn raw data into a powerful business tool. The insights gained from mastering Pivot Tables and Data Analysis will not only enhance your professional capabilities but also open up new career opportunities. 🌟
Enroll in "Microsoft Excel in 90 Minutes - Pivot Tables & Data Analysis" today and unlock the full potential of your data! Your journey to becoming a data management pro starts here. Let's transform data into stories that matter. 🚀✨
Don't miss out on this opportunity to become an Excel expert! Sign up now and join the ranks of business professionals who leverage the power of Excel to drive success. With Jeanine A.'s guidance, you'll be navigating through complex datasets with confidence and precision in no time. 📚➡️🔍
Course Gallery


Loading charts...