Essentials of Building Excel Dashboards

Why take this course?
📊 Course Title: Essentials of Building Excel Dashboards
Course Headline: 🚀 Learn All About Creating Excel Dashboards!
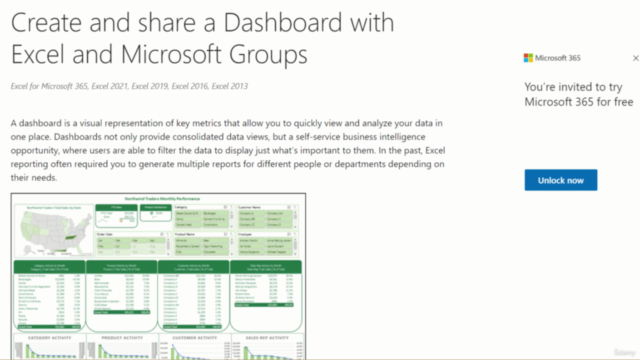
Introduction: Welcome to "Essentials of Building Excel Dashboards," the ultimate course for anyone looking to transform raw data into meaningful insights with dynamic and interactive dashboards in Microsoft Excel. Whether you're a business analyst, a manager, or an aspiring data enthusiast, this course will equip you with the skills to create powerful and effective dashboards that can significantly enhance decision-making processes.
What You Will Learn:
- The Basics of Dashboard Creation: We'll start at the very beginning, understanding what a dashboard is and why it's an essential tool for data analysis.
- Dashboard Design Principles: Learn how to design your dashboard for clarity, impact, and ease of use.
- Data Visualization Techniques: Master the art of visualizing data effectively with charts, graphs, and tables that provide immediate insights.
- Interactive Elements: Discover how to create interactive elements within your dashboard, allowing users to filter data and drill down for more detailed information.
- Dashboard Automation: Learn to automate parts of your dashboard to ensure that data is always up-to-date without manual intervention.
- Advanced Formatting and Troubleshooting: Get tips on advanced formatting to make your dashboards look professional, and learn how to troubleshoot common issues.
Course Outline:
- Understanding Dashboards: What they are and the value they bring to data analysis.
- Setting Up Your First Dashboard: Step-by-step guidance on creating a basic dashboard.
- Data Visualization Essentials: Using charts, tables, and conditional formatting effectively.
- Interactive Components: How to incorporate slicers, pivots, and data bars into your dashboards for user interaction.
- Advanced Dashboard Features: Creating dashboards that can pull data from various sources and even include maps!
- Dashboard Automation: Setting up dashboards to refresh with new data automatically.
- Final Project: Apply what you've learned to build a comprehensive dashboard for a real-world scenario.
Why Take This Course?
- Practical Skills: You'll learn through hands-on practice, ensuring that you can immediately apply your new skills.
- Real-World Applications: The techniques taught are not just theoretical; they are practical and applicable to a wide range of industries.
- Self-Service Analytics: Empower users within your organization to access their own data without needing extensive help.
- Time Efficiency: Learn how to create dashboards that provide the information you need at a glance, saving time and effort.
- Decision Making: Equip yourself with tools to make informed decisions based on data, not intuition.
Who Is This Course For? This course is perfect for anyone looking to:
- Improve their data analysis skills using Excel.
- Create more efficient and effective reports.
- Offer better business intelligence opportunities within their organization.
- Enhance their resume with valuable Excel skills.
- Transition from manual reporting to self-service analytics.
Conclusion: By the end of this course, you'll not only have a solid understanding of how to create and manage Excel dashboards but also possess the ability to turn your data into actionable insights. Whether you're managing projects, improving customer service, optimizing retail management, or forecasting financial performance, "Essentials of Building Excel Dashboards" will be your guide to success. 🎓
Enroll today and take the first step towards mastering Excel dashboards!
Course Gallery


Loading charts...