Building dynamic interactive human resource dashboard, Excel

Why take this course?
🌟 Course Title: Building Dynamic Interactive Human Resource Dashboards with Excel
🚀 Course Headline: Unlock the Power of HR Data - Create Compelling HR Statistics & Visualize Them on a Dynamic Dashboard!
Welcome to a Game-Changer in HR Analytics!
Are you an HR professional looking to transform your raw data into actionable insights? Or perhaps a data enthusiast eager to master Excel's capabilities for HR analytics? Whatever your reason, this Building Dynamic Interactive Human Resource Dashboards with Excel course is designed to equip you with the skills needed to create a dashboard that not only displays data but tells a story.
What You'll Learn:
- 📊 Dashboard Creation: Learn how to design a dynamic and interactive HR dashboard from scratch using Excel.
- Data Manipulation: Master the use of Pivot Tables, Pivot Charts, and Slicers to manipulate and analyze your data efficiently.
- Dynamic Interaction: Understand how to create a dashboard that allows users to interact with the data, filter views, and gain deeper insights.
- Data Visualization Techniques: Discover the best practices for presenting complex HR data in a user-friendly, visually appealing manner.
- Advanced Data Analysis: Dive into advanced analytical tools within Excel that will help you slice and dice your data to uncover hidden patterns and trends.
Why This Course?
- Interactive Learning: Engage with real-world examples and hands-on exercises that mimic HR scenarios.
- Expert Guidance: Learn from Gloria Tibakunirwa, an experienced course instructor with a track record of successful data analysis in the HR field.
- Practical Application: Apply what you learn directly to your own HR datasets for immediate, practical results.
- Versatile Skills: Gain skills that are highly sought after in today's data-driven corporate world.
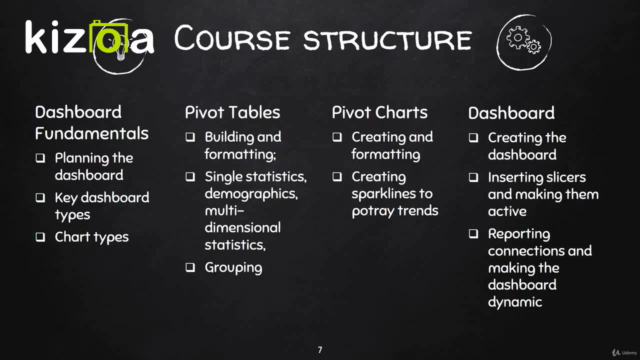
Course Structure:
-
Introduction to Dashboards: Understanding the importance and benefits of a dynamic dashboard.
-
Data Preparation: How to clean, organize, and prepare your HR datasets for analysis.
-
Pivot Tables Mastery: Learning how to use pivot tables to summarize data and extract meaningful information.
-
Pivot Charts Unleashed: Creating charts that complement your pivot tables for better storytelling.
-
Slicers & Filters: Making your dashboard interactive with slicers, filters, and dynamic data exploration tools.
-
Advanced Pivot Table Techniques: Diving deeper into data analysis capabilities of Excel's pivot tables.
-
Dashboard Design Principles: Best practices for designing an engaging, informative, and user-friendly dashboard.
-
Final Project: Apply all the skills learned to create your own comprehensive HR dashboard.
Who Is This Course For?
- HR professionals looking to leverage data in decision-making processes.
- Data analysts who want to specialize in HR analytics.
- Managers and leaders in HR who need to understand trends, patterns, and key performance indicators.
- Anyone interested in learning how to use Excel for advanced data analysis and visualization.
Get Ready to Transform Your HR Analytics Game!
By the end of this course, you'll have a solid understanding of how to turn raw HR data into a dynamic, interactive dashboard that not only displays data but provides insights that can drive strategic HR decisions. Enroll now and embark on your journey towards becoming an HR analytics expert with Excel! 📈🚀
Don't miss out on this opportunity to revolutionize the way you handle human resource data. Sign up for Building Dynamic Interactive Human Resource Dashboards with Excel today and take the first step towards becoming an HR analytics pro!
Course Gallery


Loading charts...