Building Big Data Pipelines with SparkR & PowerBI & MongoDB

Why take this course?
🚀 Course Title: Building Big Data Pipelines with SparkR & PowerBI & MongoDB
🎓 Course Headline: Master RSpark and MongoDB for Big Data Processing, Predictive Modeling, and Advanced Visualization with PowerBI Desktop! 📊
Welcome to the Building Big Data Pipelines with SparkR & PowerBI & MongoDB Course! 🎉
In this comprehensive course, we embark on an exciting journey through the world of big data analytics using R, a versatile and powerful programming language. Our focus will be on leveraging cutting-edge technologies like Apache Spark, MongoDB, and Power BI Desktop to process, analyze, and visualize massive datasets.
📈 Course Overview:
Our use case revolves around raw earthquake data, where we'll apply big data processing techniques to extract, transform, and load the information into usable datasets. After mastering the art of data manipulation, cleaning, and transformation with Spark's distributed data frames, we'll proceed to build robust predictive analytics models and create compelling visualizations.
SparkR is a game-changer for R users, offering a seamless interface to utilize Apache Spark's capabilities directly from the R environment. It's perfect for those looking to handle large datasets with operations like selection, filtering, aggregation, and more, all while maintaining the familiar feel of dplyr in R.
MongoDB, as a NoSQL database, excels in storing unstructured data in document form, which is incredibly useful when dealing with diverse and high-volume datasets. It's an essential component for our big data processing pipeline.
📊 What You'll Learn:
-
🚦 Big Data Processing Pipelines with R & MongoDB: Discover how to create efficient and scalable pipelines that can handle the demands of big data.
-
🧠 Machine Learning with SparkR & MLlib: Explore the capabilities of machine learning libraries within SparkR, focusing on geospatial data analysis.
-
📊 Data Analysis with SparkR & R: Dive deep into data analysis using advanced R techniques and SparkR's distributed computing power.
-
🔨 Manipulating Data with Spark DataFrames: Learn how to manipulate, clean, and transform large datasets using the powerful capabilities of Spark dataframes.
-
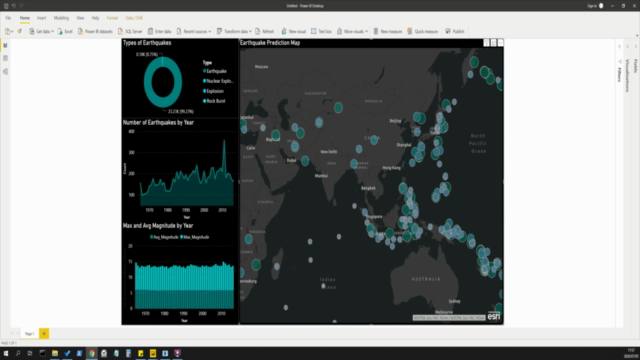
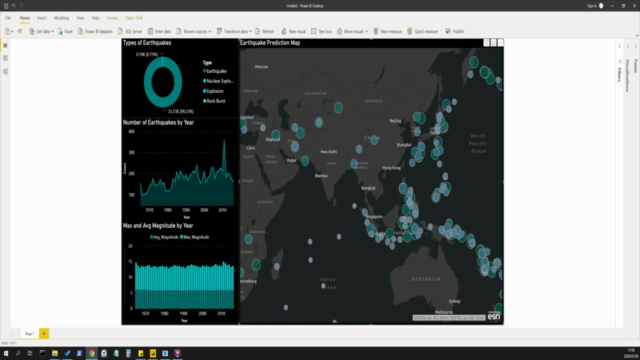
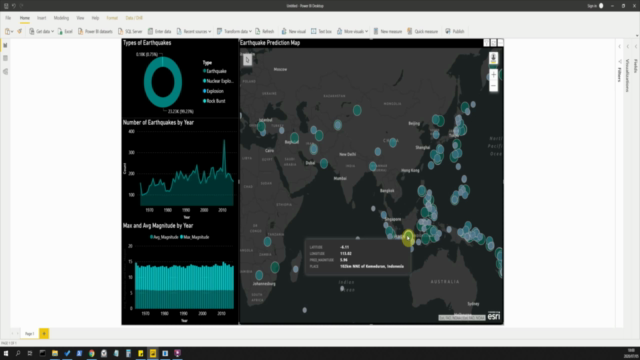
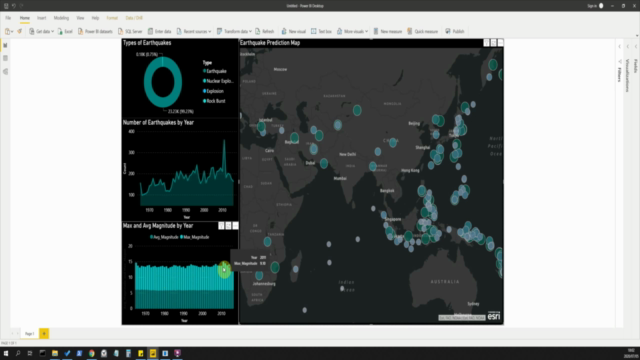
🌍 Creating Geo Maps in PowerBI Desktop: Transform your data into geospatial visualizations that bring location intelligence to life.
-
🔢 Building Dashboards with PowerBI Desktop: Master the art of creating interactive dashboards that tell compelling stories with your data.
Why Take This Course?
By the end of this course, you will have a solid understanding of how to work with big data using SparkR and MongoDB, combined with the powerful data visualization capabilities of Power BI Desktop. You'll be equipped to extract valuable insights from large datasets and communicate your findings effectively through dynamic dashboards.
👩🏫 Your Instructor: EBISYS R&D is a leader in developing innovative solutions using the latest technologies, and they bring their expertise directly to you in this course.
Enroll Now and Transform Your Data into Actionable Insights! 🚀
Course Gallery


Loading charts...