Building Big Data Pipelines with R & Sparklyr & Power BI

Why take this course?
🌐 Course Title: Building Big Data Pipelines with R & Sparklyr & Power BI
🚀 Headline: Master R for Big Data Processing, Predictive Modeling, and Visualization with Power BI Desktop!
Welcome to the Building Big Data Pipelines with R & Sparklyr & PowerBI Course! 📊💫
In this comprehensive course, we embark on a journey through the world of big data analytics using R, a versatile and powerful programming language. Our focus will be on creating robust big data processing pipelines that can handle vast datasets efficiently.
Why This Course?
- Hands-On Experience: Learn by doing with real-world scenarios, including working with earthquake data.
- Big Data Technologies: Gain expertise in using R, Sparklyr, and Power BI Desktop for big data analytics.
- Practical Skills: From data processing to predictive modeling, visualization, and dashboard creation, this course covers it all.
Course Outline:
- 🌱 Understanding the Ecosystem: An introduction to the tools we'll be using – R, Sparklyr, and Power BI Desktop.
- 📊 Data Processing with Sparklyr: Leverage the power of Apache Spark within R to handle large datasets.
- 📈 Machine Learning with Geospatial Data: Explore Sparklyr's machine learning capabilities using geospatial data.
- 🧠 Data Analysis Techniques: Learn to perform complex data analysis using the combined strengths of R, Sparklyr, and Power BI Desktop.
- 🔁 Data Manipulation & Transformation: Master the art of manipulating, cleaning, and transforming data with Spark dataframes.
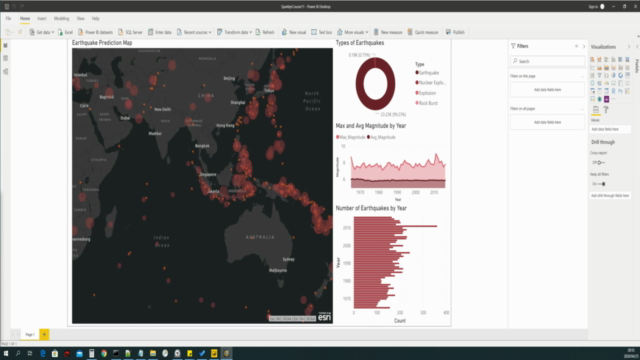
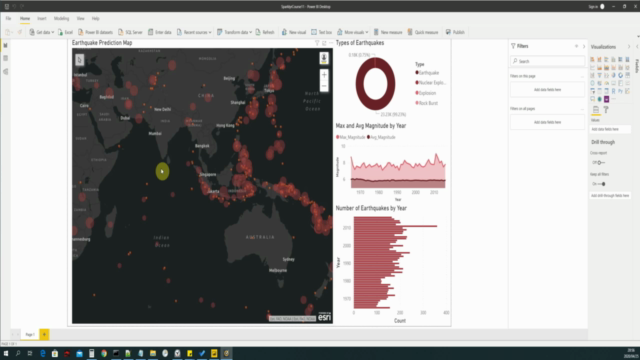
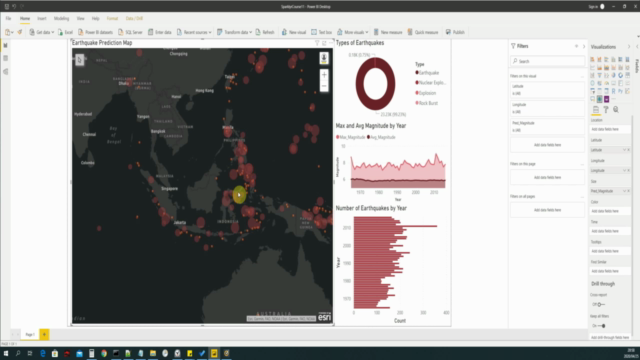
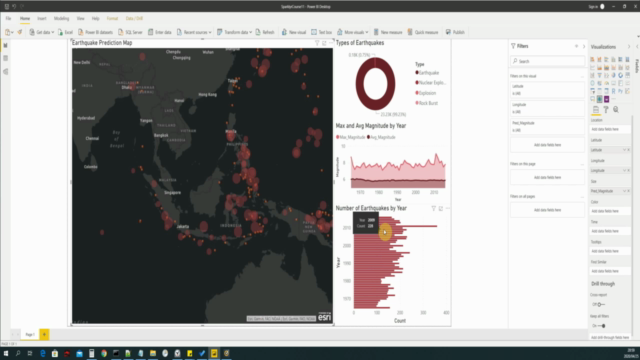
- 🌍 Creating Geo Maps in Power BI Desktop: Turn your data into visually compelling geographical maps.
- 📚 Dashboard Creation & Sharing: Build interactive dashboards that provide valuable insights into your data and share them with ease.
What You Will Learn:
- 🎯 Building Big Data Processing Pipelines using R: Transform raw data into structured datasets ready for analysis.
- 🔮 Predictive Modeling: Use R's analytical capabilities to build models that can predict future trends or outcomes.
- 📊 Data Visualization with Power BI Desktop: Learn to create advanced visualizations and reports that bring your data to life.
- 🛠️ Sparklyr for Distributed Data Analysis: Utilize Sparklyr's interface to perform distributed data analysis and machine learning.
- ✨ Interactive Learning: Engage with real datasets, hands-on exercises, and interactive sessions that solidify your understanding of big data processing and visualization.
By the end of this course, you will have a robust skill set for handling big data in R, applying machine learning techniques to geospatial data, and creating insightful visualizations and dashboards using Power BI Desktop. 🎓
Join us on this analytical adventure and unlock the full potential of your data! 🎉
Enroll now and transform your approach to big data analytics with R & Sparklyr, and elevate your visualization game with Power BI Desktop. Let's turn complex datasets into actionable insights together! 🚀📈
Course Gallery


Loading charts...