Excel Pivot Table Masterclass: Excel Reporting & Dashboards

Why take this course?
🚀 Course Title: Excel Pivot Table Masterclass: Excel Reporting & Dashboards
🎓 Headline: Sourcing data, Cleansing it, and Analyzing it through Excel pivot tables and dashboards. Master reporting & data visualization!
Unlock the Power of Data with Excel Pivot Tables and Dashboards! 💻✨
Are you ready to transform the way you handle and analyze large datasets? Whether you're a business analyst, a financial controller, or simply an Excel enthusiast eager to elevate your data game, this Excel Yourself: Excel Reporting & Dashboard Masterclass is your golden ticket! 🏫🎫
What You Will Learn:
- Sourcing Data: Efficiently gather and import data from various sources.
- Data Cleansing: Techniques to clean up your datasets for accurate analysis.
- Pivot Table Mastery: Learn the ins and outs of pivot tables, transforming raw data into powerful summaries in a snap.
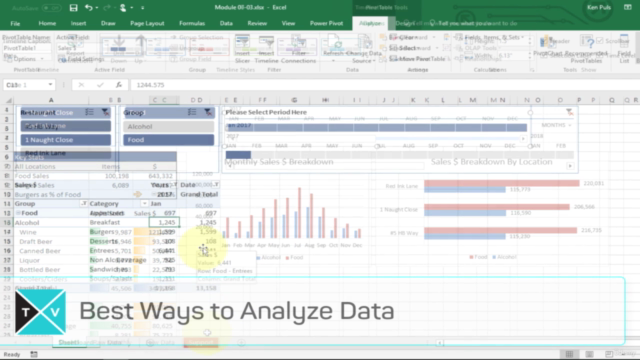
- Dashboard Creation: Design dynamic, interactive dashboards that bring your data to life.
- Advanced Analysis: Dive deep into your data with pivot table filters and slicers for granular insights.
- Practical Application: Apply what you've learned through hands-on examples and real-world scenarios.
Course Highlights:
- Tailored for Beginner/Intermediate Users: No prior knowledge of Pivot Tables is required! This course will guide you from the basics to advanced techniques.
- Real-World Skills: Learn practical skills that can be applied directly to your job, enhancing productivity and decision-making capabilities.
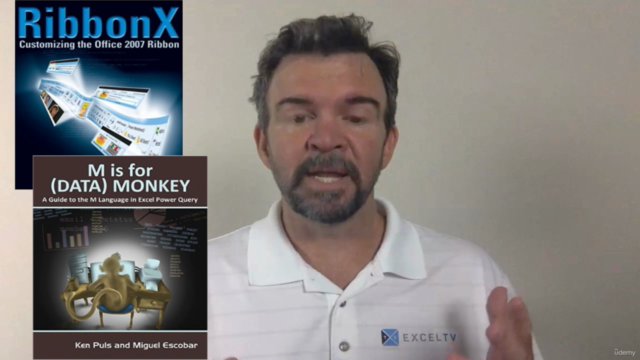
- Expert Instruction: Ken Puls, an Excel Most Valuable Professional (MVP), with over 20 years of experience in Excel, shares his expertise. He's also a renowned blogger, conference speaker, and co-author of "M is for Data Monkey" – your guide to mastering the M language in Excel Power Query.
Why You Should Take This Course:
- Impressive Resume Enhancer: Mastery of pivot tables and dashboards is a highly sought-after skill in the job market.
- Time-Saving Techniques: Automate repetitive tasks, save time, and focus on what truly matters – strategic analysis.
- Data Confidence Booster: Make informed decisions with confident data analysis.
- Community of Learners: Join a community of like-minded individuals who are passionate about data analysis and reporting.
Who Is This Course For?
This course is designed for:
- Business Analysts
- Financial Controllers
- Data Analysts
- Excel Users at all Levels (from beginner to advanced)
- Anyone interested in learning powerful Excel skills and tools for data analysis and reporting.
Enroll now and embark on a journey to become an Excel Pivot Table and Dashboard Pro! 📈🎓
Instructor Spotlight:
Ken Puls, your course instructor, is not just any Excel expert. As an Excel MVP with over two decades of experience, Ken has been instrumental in the community, offering valuable insights through his blog and sharing his knowledge at conferences worldwide. Co-authoring "M is for Data Monkey," he brings a wealth of knowledge to your learning experience. With Ken's guidance, you'll learn not just how to do things in Excel, but why certain methods are preferred, ensuring a robust understanding of best practices in data analysis and visualization. 🏅📚
Ready to Master Excel Pivot Tables and Dashboards? 🚀
Click the "Enroll Now" button and take the first step towards becoming an Excel Reporting & Dashboard expert. Transform your data handling skills today! 🎯🚀
Course Gallery


Loading charts...