Build Insightful Dashboards with Google Data Studio

Why take this course?
🌟 Build Insightful Dashboards with Google Data Studio 🌟
[Course Overview & Updates] (November 2018)
What's New? We've introduced a NEW LECTURE on The Explorer feature in Data Studio, showing you how to reach insights faster! Additionally, this course now includes Captions in English to aid your learning experience.
Unlock the Power of Data Studio
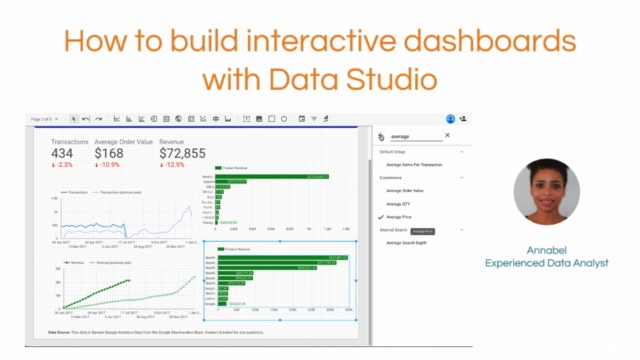
Google Data Studio is a free tool within the Google Suite, including the likes of Google Docs, Google Sheets, and Google Slides. It's designed to help you create powerful and interactive dashboards that will allow you to explore your underlying data effortlessly.
Why This Course?
This course is tailored for a diverse audience:
- Online Marketers
- Product Analysts
- Data Analysts
- Product Owners/Managers
- Small Business Owners
Regardless of your role, if you're looking to extract meaningful insights from your data and communicate them effectively through dashboards, this course is for you.
Data Sources & Tools
Data Studio can connect to a multitude of data sources, including:
- Google Analytics
- Adwords or other Google Products
- Google Sheets
- Excel
It stands on three key pillars:
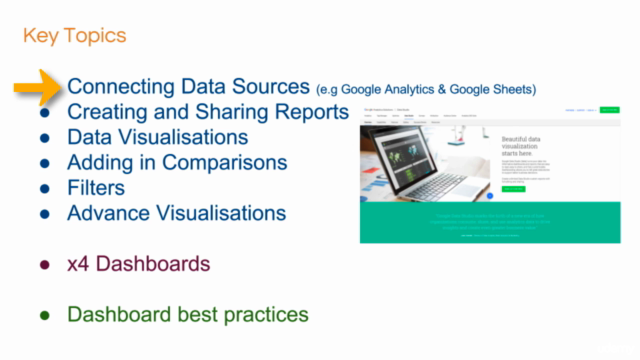
- Connecting to many data sources
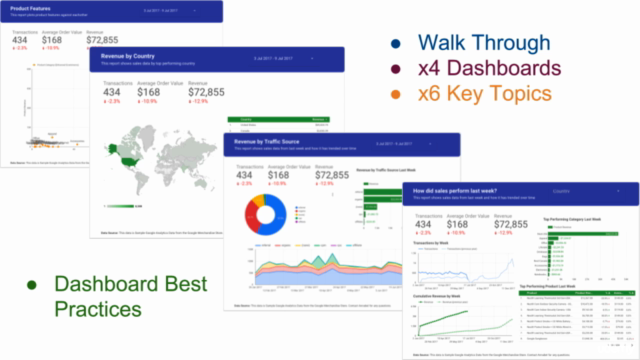
- Visualising data through a range of customisable reports and widgets
- Sharing dashboards for collaboration and communicating insights
Course Structure & New Additions
May 2018: We've introduced a new lecture, 'Why Data Studio?', to help you determine if Data Studio is the right tool for your needs and how it compares to other Business Intelligence Tools.
April 2018: To enhance your hands-on experience, we've added a NEW ASSIGNMENT at the end of the course. You will create a dashboard from scratch and answer key questions about the data set to receive feedback on your final Data Studio Report.
DEC 2017: Learn how to create new metrics from your existing data sets directly in Data Studio with our lecture on Calculated Metrics - Simple Arithmetic.
NOV 2017: Gain insights into handling sampling of Google Analytics Data in Data Studio.
AUG 2017: Learn how to prepare your data in Google Sheets for use in Data Studio, connect Google Sheets to Data Studio, and connect your own Google Analytics Data to power your reports.
SEPT 2017: Discover how to track the usage of your Data Studio Reports to understand your audience's engagement with your dashboards.
Course Benefits
- Intuitive Design: Create dashboard designs more intuitive than those in Google Analytics or Google Sheets.
- Versatile Data Visualisation: Utilize a variety of visualization options to represent your data effectively.
- Effortless Collaboration: Share dashboards with team members for real-time collaboration and feedback.
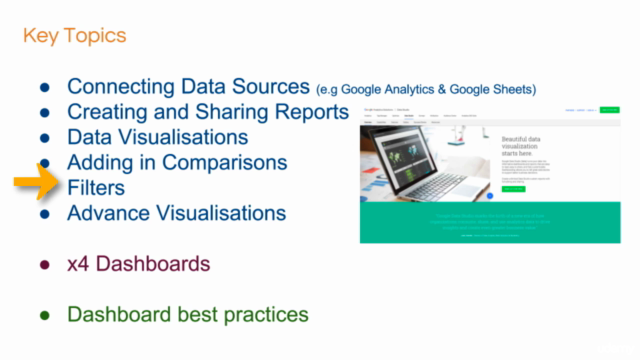
- Engaging Interactivity: Add interactive elements, like filters and sliders, to make your reports more dynamic and user-friendly.
- Insightful Reporting: Transform raw data into actionable insights through thoughtfully designed visualizations.
Join the Course
Embark on a journey to master Google Data Studio and turn your data into compelling stories. With this comprehensive course, you'll unlock the potential of your data like never before. 📊✨
Course Gallery


Loading charts...