Master Streamlit: Build Dashboards with Streamlit & Python

Why take this course?
🚀 Build Amazing Dashboards using Streamlit and Plotly Express!
Are you ready to transform your data into stunning, interactive dashboards? 📊✨ With our comprehensive online course "Build Data Products with Streamlit and Plotly Express", you'll dive into the world of data applications and emerge as a Data Dashboard Ninja!
Why Streamlit & Plotly Express?
- Streamlit: It's the ultimate tool for developers who want to turn their Python scripts into web applications with minimal effort. Say goodbye to complex HTML or CSS and hello to a beautiful interface that's entirely Python-based. 🐍💻
- Plotly Express: This powerful visualization library is your secret weapon for creating visually appealing and insightful plots with ease. It's the perfect complement to Streamlit, allowing you to craft dashboards that stand out from the crowd.
Course Highlights:
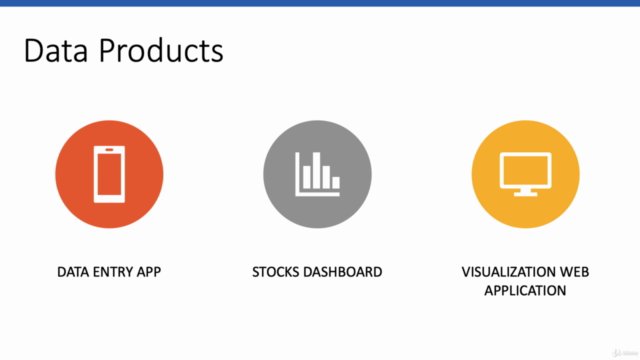
🔥 Hands-On Learning: Through the creation of 3 practical applications:
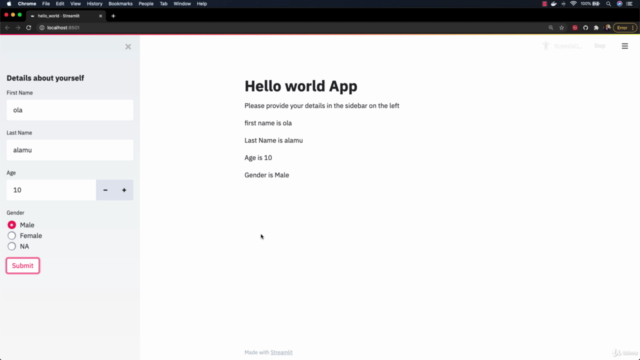
- A simple Data Entry "Hello World" Application to get you started.
- An advanced Stocks Dashboard Application to analyze real-time financial data.
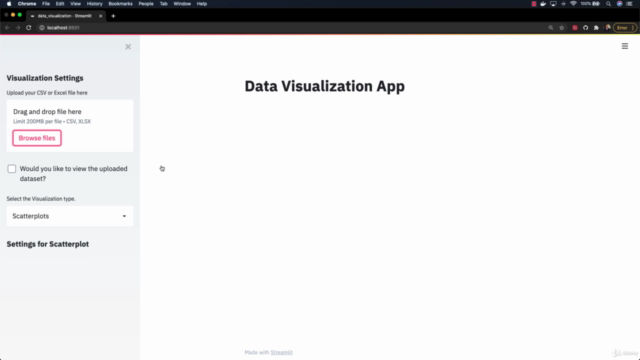
- A sophisticated Data Visualization Web Application that showcases your analytical skills.
🔍 Master Data Visualization: Learn how to seamlessly integrate visualizations into your Streamlit app using Plotly Express. With its intuitive and interactive charts, you'll be able to present data in a way that tells a compelling story.
✅ No HTML/CSS Required: Everything you build will be through Python. It doesn't get more streamlined than this!
🧠 For Data Scientists & Python Developers: Whether you're a seasoned data scientist or a Python developer looking to expand your skill set, this course is tailored for you.
👩💻 Essential Skills in Under 2 Hours: By the end of this introductory course, you'll be confidently using Streamlit and Plotly Express to create your own data applications. It's a quick and effective way to start your journey with these powerful tools.
🎓 Your Path to Mastery: This free course serves as the foundation for mastering Streamlit and Plotly Express, setting you on a path to becoming a full-fledged data product professional.
Enroll Now! 🚀 Don't miss out on this opportunity to elevate your data handling skills and build amazing dashboards with Streamlit and Plotly Express. Enroll in the "Build Data Products with Streamlit and Plotly Express" course today and join the ranks of top-tier Python developers and data scientists! 🎓🎉
Enroll now and embark on your journey to becoming a Data Dashboard Ninja! With our structured, hands-on approach, you'll learn how to craft interactive, real-time dashboards that not only look great but are also incredibly user-friendly. Whether you're a beginner or an experienced Python developer, this course is designed to help you leverage the full potential of Streamlit and Plotly Express in the realm of data science.
👉 Take the next step in your data career - Join us, and let's make data come alive! 🌟✨
Course Gallery


Loading charts...