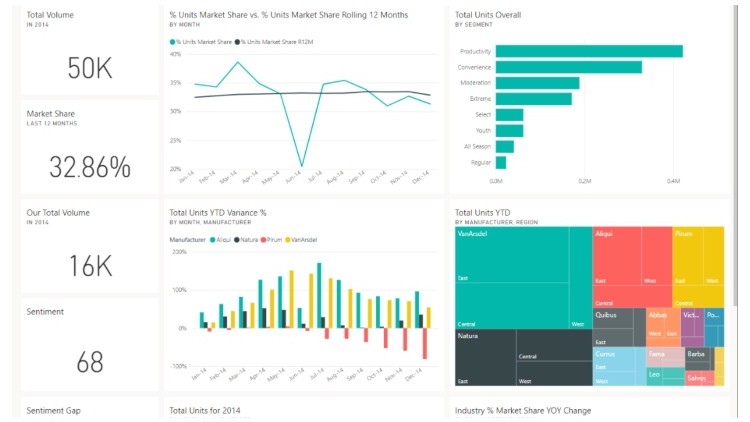
Power BI Dashboard for beginners

Why take this course?
Master Data Insights with Power BI Dashboard for Beginners 🚀
Dive into the world of data analysis with our comprehensive online course designed for absolute beginners. By the end of this course, you'll be able to Connect, Transform, and Visualize data like a pro, culminating in the creation of powerful dashboards using Power BI! 📊✨
Course Overview:
Power BI Dashboard for Beginners is your gateway into the realm of business intelligence. This course will guide you through the process of harnessing the full potential of data to inform and influence decision-making processes within an organization.
What You'll Learn:
-
Understanding Dashboards: Discover how dashboards in Power BI serve as a dynamic, single-page collection of visualizations that encapsulate critical data insights.
-
Data Gathering and Transformation: Learn to connect Power BI Desktop to various data sources, clean and prepare your data for analysis by transforming it into a structured format, and establish relationships between different datasets.
-
Visualization Techniques: Master the art of visual storytelling by creating compelling charts, graphs, and other visuals that clearly represent your data.
-
Publishing Reports: Gain the skills to publish your reports from Power BI Desktop to the Power BI Service for widespread accessibility and sharing.
Course Highlights:
-
Easy Data Connection: Explore over 110+ Power BI connectors to various cloud services, including GitHub, as well as generic sources like XML, CSV, text, ODBC, and even direct extraction from websites.
-
Data Transformation Mastery: Understand the importance of transforming raw data into a usable format by splitting columns, renaming, changing data types, and defining relationships.
-
Visualization at Your Fingertips: Utilize Power BI's extensive library of visuals to create dashboards that not only inform but also captivate your audience with insightful data representation.
Why Take This Course?
-
Real-World Skills: Equip yourself with practical skills that are in high demand across various industries.
-
Interactive Learning: Engage with the course material through hands-on exercises and real-world scenarios.
-
Empower Your Career: Stand out in your field by becoming proficient in one of the most powerful data analysis tools available today.
Course Requirements:
-
Basic understanding of data concepts.
-
Familiarity with general computer usage and navigating applications.
How to Get Started:
-
Enroll Now: Secure your spot in the course and begin your journey into the world of Power BI.
-
Follow Along: Step-by-step guidance will lead you through each module, ensuring you grasp the concepts before moving on to more complex topics.
-
Practice Makes Perfect: Apply what you learn with practical exercises that reinforce learning and build confidence.
-
Expert Support: Access our supportive community of learners and expert instructors who are there to help you through any challenges.
Join us on this transformative learning journey and unlock the power of data with Power BI Dashboard for Beginners. 🌟 Enroll today and be one step closer to becoming a data analysis guru!
Loading charts...