【한글자막】 알고리즘 거래와 투자의 기술적 분석 with Python
Why take this course?
이 텍스트는 Udemy에서 제공하는 Python을 사용한 기술적 분석 강의의 개요와 소개를 담고 있습니다. 강의는 Python과 관련된 데이터 과학 라이브러리를 활용하여 기술적 분석 지표를 코딩하고 테스트하는 방법을 배울 수 있게 설명합니다. 강의는 초보자가 아닌, 파이썬에 일정 수준 이상의 알지어 possessing learners in mind. It emphasizes the practical application of technical analysis indicators and trading strategies using Python's scientific libraries and visualization tools.
The overview includes:
- Introduction to Trading and Investment Markets
- Understanding Technical Analysis
- Setting up the Development Environment (Installation of free software)
- Introduction to Programming with Python
- Exploring Financial Data with Pandas
- Visualizing Data with Matplotlib and Plotly
- Applying Moving Averages (Simple Moving Average, Exponential Moving Average)
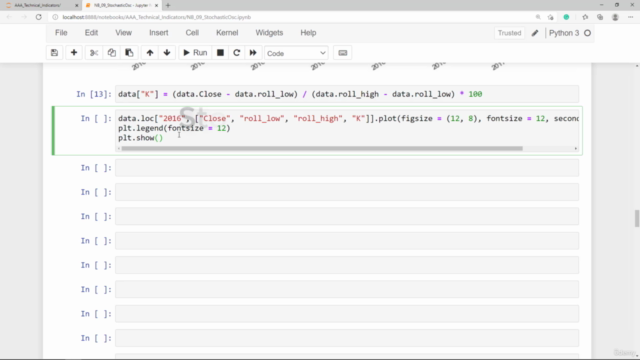
- Bollinger Bands, MACD, RSI, Stochastic Oscillator, Fibonacci Retracement, Pivot Points, and more
- Introduction to Combinatorial and Combination Trading Strategies
- Backtesting Trading Strategies
- Conclusion and Next Steps
The course also provides coding templates and frameworks for learners to quickly implement and test numerous trading strategies within a short period. It is designed to help data analysts, traders, and investors enhance their expertise in technical analysis using Python's powerful libraries and apply them effectively in their professional work.
The instructor, Alexander, has over ten years of experience in the financial and investment industry and is a best-selling Udemy instructor. He assures that by the end of the course, learners will be able to code and test their trading ideas and hypotheses using technical analysis indicators and strategies within the Python environment.
The course also offers a 30-day money-back guarantee, ensuring low risk for potential learners. Alexander encourages learners to enroll and explore the possibilities of applying technical analysis effectively in their business ventures or investment decisions.
Course Gallery
Loading charts...