A Beginners Guide to Technical Analysis of Stock Charts

Why take this course?
📈 A Beginner's Guide to Technical Analysis of Stock Charts
Course Headline: 🚀 Learn all about charting from A-Z from an experienced Trader - Increase your odds of Success trading the Stock Market!
Instructor: Tom Watson - A seasoned Professional Trader with a wealth of knowledge in Swing and Day Trading.
Course Description:
Embark on a comprehensive learning journey with our Beginner's Guide to Technical Analysis of Stock Charts course, where you'll unlock the secrets used by full-time Professional Traders. Whether you're into Swing Trading or Day Trading, understanding how to analyze daily and weekly charts is crucial for success in the stock market.
What You'll Learn:
-
The Basics of Chart Reading: Dive into the foundational concepts of charting, essential for both Swing and Day Traders alike.
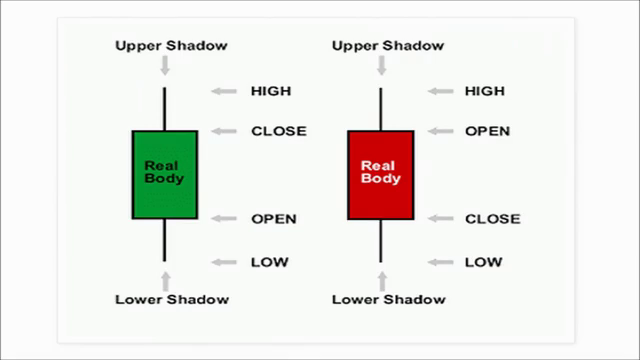
- Understanding price movements and candlestick patterns.
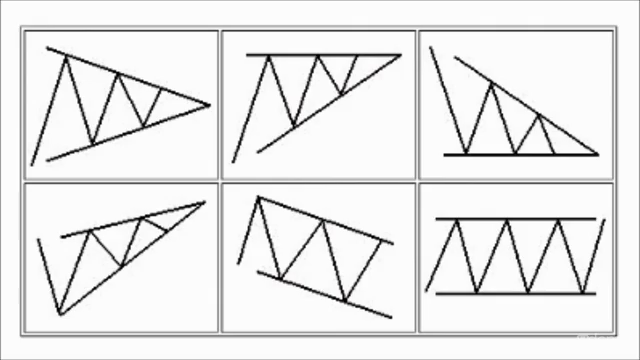
- Identifying support and resistance levels.
-
Technical Indicators Explained: Get to grips with a variety of indicators, from the most common to the advanced ones, through our 50 video lessons, totaling an impressive 8.5 hours of content.
- Moving Averages (SMA, EMA)
- Bollinger Bands
- Relative Strength Index (RSI)
- MACD & Fibonacci Retracement
- And many more!
-
Practical Application: Each lesson is not just theoretical; it's a visual guide to understanding how these indicators are applied in real trading scenarios.
- Real-time examples of each indicator in action.
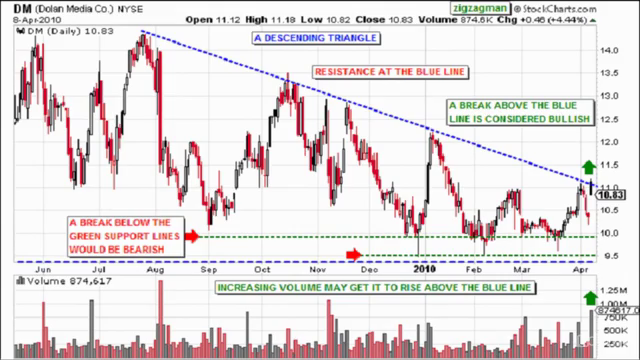
- Strategies and techniques demonstrated on actual stock charts.
-
Choosing Your Indicators: Navigate through the myriad of indicators available and learn how to select the most appropriate ones for your trading style.
- The art of avoiding multicollinearity and overcrowding your chart.
- How to combine indicators effectively for better decision-making.
-
Hands-On Learning: Interactive Live Sessions with Tom Watson, where you can discuss your favorite stock charts and get personalized feedback.
-
Direct Support: Have a question or need further clarification on any topic? Tom Watson ensures that all student inquiries are promptly addressed, providing you with the support you need to master technical analysis.
Why This Course?
- Expert Guidance: Learn from someone who's been in the trenches and knows the market inside out.
- Comprehensive Coverage: From A to Z, we cover everything you need to know about stock charting and technical analysis.
- Real-World Application: The knowledge you gain is directly applicable to your trading, giving you a practical edge in the markets.
- Community Interaction: Engage with fellow traders through live sessions and group discussions.
Who This Course Is For:
This course is ideal for:
- Beginners looking to start their journey into the world of stock trading.
- Experienced traders seeking to refine their charting skills.
- Investors interested in understanding market movements more deeply.
Take the first step towards mastering technical analysis with our Beginner's Guide to Technical Analysis of Stock Charts and join a community of successful traders today! 🎓✨
Course Gallery


Loading charts...