Data Visualization for Beginners

Why take this course?
🎉 Data Visualization for Beginners: A Comprehensive Guide to Making Your Data Sing! 📊
Course Instructor: Lecture Factory
Course Title: Data Visualization for Beginners
Course Headline: Comprehensive guide to data visualization including hands-on tutorials
🚀 Course Description:
Embark on a journey to transform your data into compelling visual narratives with our "Data Visualization for Beginners" course. This is where your data story begins! 🌍
Why Join?
- Step-by-Step Learning: Whether you're a data novice or eager to polish your skills, this course will guide you through the world of data visualization with clear, easy-to-follow instructions.
- No Prior Knowledge Required: This course is tailored for beginners and assumes no prior experience in data visualization or coding. 🏗️
- Hands-On Approach: Dive into practical, hands-on tutorials that will equip you with the skills to create interactive maps and graphs from your own datasets.
- Enhance Your Storytelling Skills: Learn how to craft a narrative around your data, making your presentations more engaging and impactful. 🎤✨
Course Breakdown:
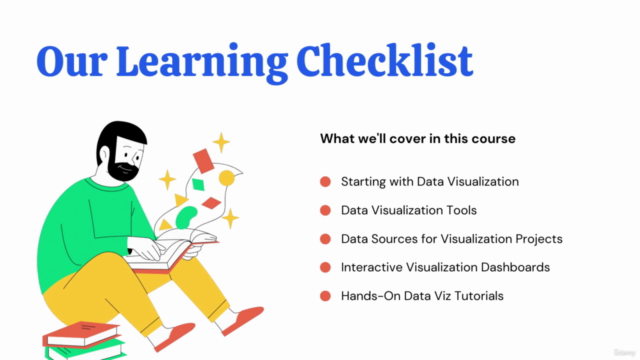
- Understanding the Basics: Gain insights into the fundamental concepts of data visualization.
- Exploring Chart Types & Tools: Discover different types of charts and tools available for visualizing your data.
- Hands-On Tutorials: Follow along with practical tutorials that will show you how to import your data and bring it to life through visualizations. 🖥️📈
- Chapter Highlights:
- Fundamentals of Data Visualization: Learn the foundational principles that make data visualizations effective and understandable.
- Visualization Tools & Techniques: Explore various tools and techniques to create engaging visuals.
- Data Importing & Preparation: Find out how to import your data and prepare it for visualization.
- Interactive Maps & Graphs: Learn how to make your visualizations interactive, adding a new dimension of engagement. 🗺️📊
- Real-World Examples & Data Sources: Get hands-on with real-world data sets and follow along with tutorials using provided example data sources.
- Final Project: Apply your newly acquired skills to a final project, showcasing all you've learned in this course.
What You Will Learn:
- Define different chart types and understand their applications.
- Identify the right tools for your data visualization needs.
- Import your data and turn it into interactive and engaging visualizations.
- Tell stories with data, making complex information accessible to everyone. 📚
Join Us Today!
Dive into a world where data doesn't just sit in spreadsheets—it tells a story that engages, informs, and inspires. With this course, you'll be able to harness the power of data visualization to make your data tell the story it's meant to tell. 🌟
Enroll now and transform how you communicate with data! 🚀✨
Course Gallery


Loading charts...