Basics of R Software for Data Science

Why take this course?
🎓 Mastering Descriptive Statistics with R Software: A Comprehensive Online Course by Prof. R. Madana Mohan
🚀 Course Title: Basics of R Software for Data Science 📊
👩🏫 Course Headline: Discover the Power of Descriptive Statistics using R Software
Unlock the World of Data with R Software for Data Science!
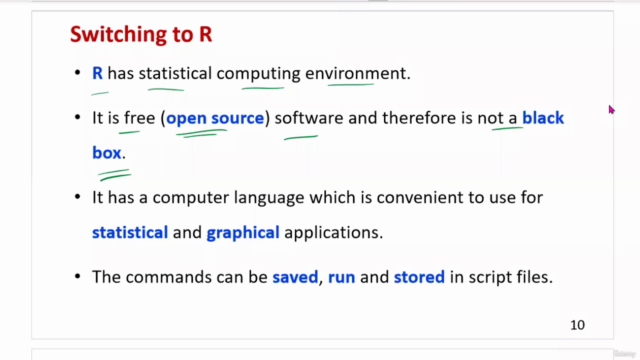
R is not just another software in the realm of data analysis. It's an open source treasure trove that offers a comprehensive suite of tools for statistical modeling, data visualization, and so much more. With its intuitive interface and versatile capabilities, R stands out as a preferred choice among professionals and academicians alike.
✅ Why Choose R?
- Versatility: R is incredibly adaptable, running on various operating systems including Windows, Mac OS, and UNIX/LINUX platforms.
- Community Support: A large global community contributes to its continuous improvement and extensive package libraries.
- Functionality: From simple calculations to complex data analysis, R handles it all with finesse.
- Compatibility: Its cross-platform compatibility makes it a go-to tool for handling large and intricate datasets.
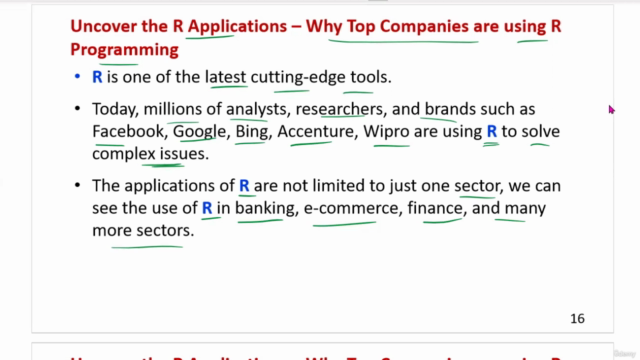
- Industry Adoption: Tech giants like Microsoft and Twitter use R for its robust analytics capabilities.
🔍 Dive into Descriptive Statistics Understanding data is the cornerstone of any data science endeavor, and descriptive statistics play a pivotal role in this process. This course will guide you through the fundamental tools and techniques of descriptive statistics, demonstrating how to effectively apply them within the R software environment.
Course Highlights:
- Introduction to R Software: Get familiar with the R interface, packages, and basic commands.
- Data Importing & Manipulation: Learn how to import data from various sources and manipulate it using R's powerful data management tools.
- Core Functions of Descriptive Statistics: Explore measures of central tendency, dispersion, and shape.
- Visualization Techniques: Master plotting with R's graphics capabilities to visualize data effectively.
- Real-World Applications: Discover how descriptive statistics can be applied across different industries to derive meaningful insights from data.
What You Will Learn:
- How to set up your R environment and install necessary packages.
- The essential commands for data analysis, including data subsetting, summarizing, and cleaning.
- How to calculate and interpret statistical measures such as mean, median, mode, variance, and standard deviation.
- Techniques for visualizing data with histograms, scatterplots, and more.
- Practical case studies showcasing the application of descriptive statistics in real-world scenarios.
Who Should Take This Course? This course is designed for:
- Beginners to R Software looking to build a strong foundation in data science.
- Data analysts seeking to enhance their skills with descriptive statistical methods.
- Students and researchers interested in the intersection of statistics and computing.
- Professionals from any industry who want to leverage data effectively for decision-making.
📅 Start Your Data Science Journey Today! By enrolling in this course, you're taking a significant step towards becoming proficient in R Software and mastering the art of descriptive statistics. Join us and learn from an expert like Prof. R. Madana Mohan, who will guide you through every step of the learning process with clarity and enthusiasm.
🎓 Elevate your data analysis skills with "Basics of R Software for Data Science" - where the world of data opens up before you! 🚀
Course Gallery


Loading charts...