Pitch Location Charts with PITCHf/x and ggplot

Why take this course?
GroupLayout: Pitch Location Charts with PITCHf/x and ggplot 🎓✨
Course Title: Pitch Location Charts with PITCHf/x and ggplot Headline: Visually analyze each at-bat of a baseball game with precision and insight!
Course Description:
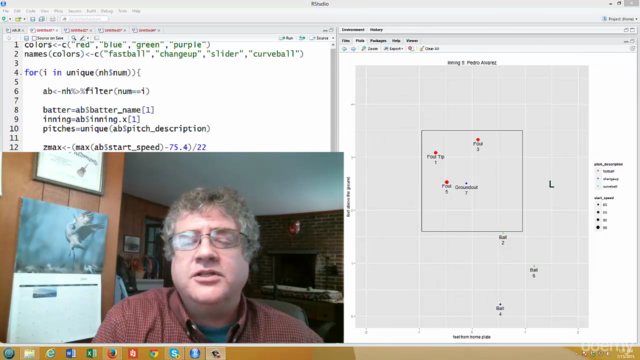
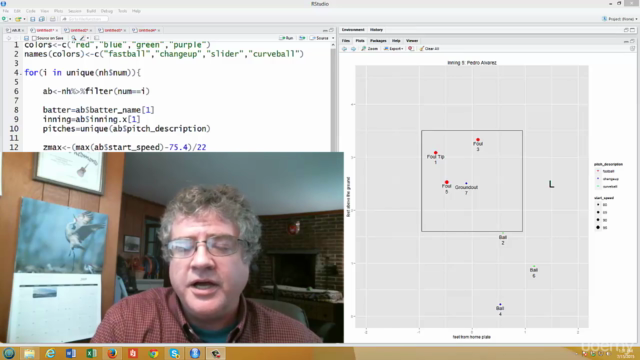
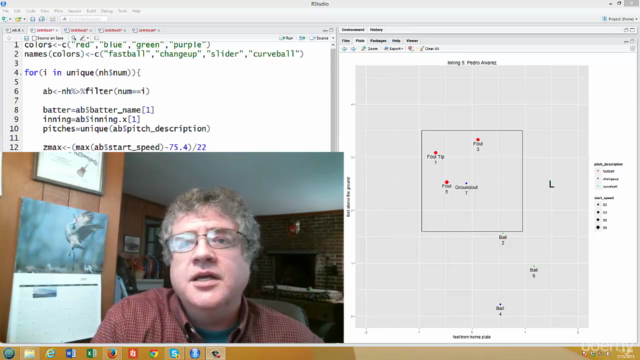
Welcome to the world of data-driven baseball analysis! In this comprehensive online course, we delve into the fascinating realm of pitch location tracking using cutting-edge PITCHf/x technology. Our journey together will take you through the intricacies of each at-bat during a baseball game, allowing you to visualize and interpret the pitch data like never before.
- Pitch Location Analysis: Learn to map every pitch's location and understand its impact on the outcome.
- Data Subsetting: Master subsetting vectors in R for targeted data analysis.
- R Skills Enhancement: Improve your proficiency in R, dplyr, and ggplot for a more nuanced approach to data visualization.
- Working with Factors: Understand the importance of factors and how they can influence your analysis.
- Aesthetic Utilization: Explore the use of color and aesthetics in ggplot for clearer and more effective charts.
- Faceting Techniques: Discover advanced faceting methods to organize and interpret your pitch location data efficiently.
Course Structure Breakdown:
-
Introduction to PITCHf/x Data: We kick off by exploring the world of PITCHf/x, understanding its significance in baseball analytics, and how it can be used to gain insights into a pitcher's repertoire.
-
R Primer: A gentle introduction for those with basic R skills or a refresher course for more experienced users. We cover essential R commands and the use of dplyr to manipulate data sets effectively.
-
ggplot Deep Dive: Dive into the ggplot2 package, learning how to create complex graphics that are both informative and beautiful. From basics to advanced techniques, you'll be creating intricate pitch location charts in no time!
-
Data Visualization with ggplot: Learn to visualize the pitch data by plotting different types of pitches, their locations, velocities, and outcomes. You'll create compelling stories from the data that can influence pitching strategies and more.
-
Analyzing Each At-Bat: Break down each at-bat to understand the sequence of pitches thrown, the batter's reaction, and the outcome. This hands-on approach will solidify your understanding of how pitchers operate within an at-bat situation.
-
Final Project: Cap off your learning with a project where you analyze real PITCHf/x data to create a comprehensive pitch location chart for an entire game or selected at-bats. Present your findings and visualizations to the class.
Why Enroll?
- Interactive Learning: This course is not just about theoretical knowledge; it's about applying what you learn to real baseball data.
- Real-World Skills: Acquire skills that are highly sought after in sports analytics, a burgeoning field with numerous career opportunities.
- Flexible Pacing: Take your time with the course material. With three weeks estimated for completion, you can go at your own pace while staying on track.
- Community Engagement: Join a community of fellow learners and baseball enthusiasts to share insights, ask questions, and collaborate on projects.
Whether you're an aspiring data analyst, a die-hard baseball fan, or just someone fascinated by the intersection of sports and statistics, this course will equip you with the tools to uncover stories hidden within pitching data. 📊⚫️
Enroll now and step into the exciting world of sports analytics and visualization! 🚀
Course Gallery


Loading charts...