Power BI Data Analysis + Microsoft certification

Why take this course?
📈 Explore Data Like Never Before with Power BI: Model Analysis and Dashboard Creation 📊
Course Objectives
Embark on a transformative journey into the realm of data visualization and analysis with our comprehensive course on Microsoft Power BI. Designed for beginners and intermediate users, this course will equip you with the skills to connect to various data sources, model your data intelligently, and create insightful dashboards and reports without the need for extensive technical expertise.
What is Power BI and Its Main Features?
Power BI is a comprehensive business intelligence platform from Microsoft that stands as a beacon of innovation in data analysis. 🚀 It empowers businesses to transform raw data into compelling stories through interactive reports and dashboards, offering a seamless integration with other Microsoft services like Azure and Office 365. With Power BI, you can:
- Connect to a multitude of data sources and turn them into actionable insights.
- Manipulate and model your data effortlessly using natural queries.
- Utilize AI capabilities for pattern recognition and receive automated insights.
- Take advantage of self-service visualization tools, making you a data analyst without the need for coding.
- Enhance collaboration and sharing through integrations with Microsoft Teams and other applications.
- Ensure your data remains secure with robust security features like row-level security.
- Develop custom visualizations and embed analytics into existing applications using Power BI's flexible APIs.
Interactive Dashboards and Reports for Informed Business Decisions
Unlock the full potential of your business data by creating interactive dashboards and comprehensive reports with Power BI. These tools will allow you to:
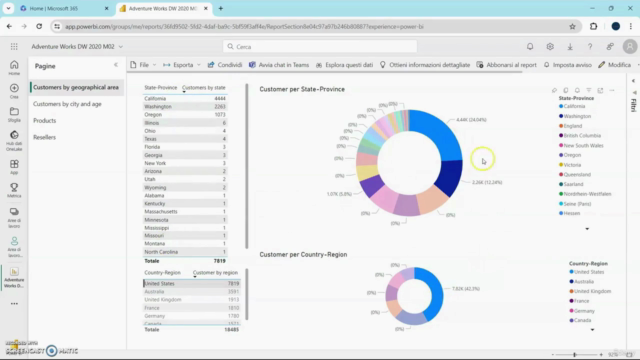
- Gain a real-time overview of your key metrics through an intuitive dashboard interface.
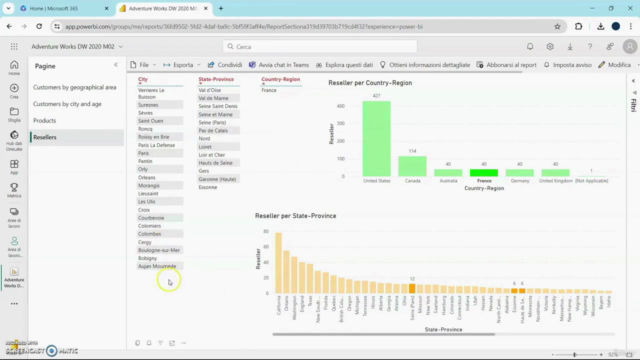
- Monitor and analyze your company's performance in a dynamic, visual format.
- Customize tiles to tell the data story unique to your business goals.
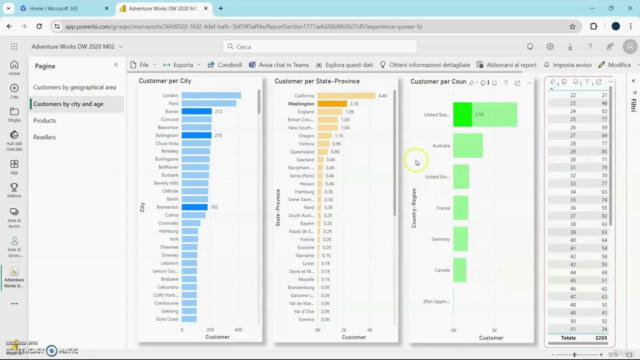
- Dive deeper into specific areas of interest with detailed reports that can be accessed from within your dashboards.
- Use drillthrough features for an in-depth examination of underlying data points.
- Leverage the Q&A feature to explore data through natural language queries.
With our course, you'll learn how to:
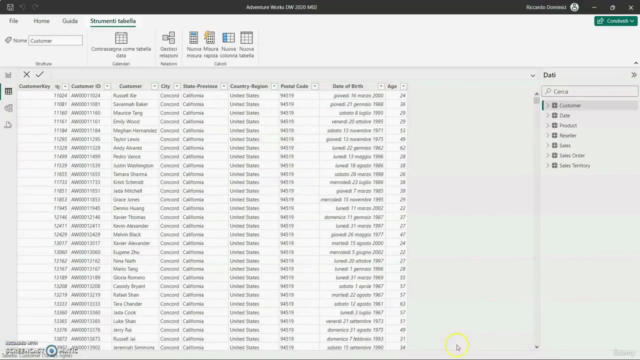
- Connect to a pre-existing Microsoft model with 18,000 rows and many columns.
- Master the creation of pivot tables and charts in minutes, rather than hours.
- Understand how to interpret your data to make informed business decisions.
- Explore the latest features like Copilot in Power BI for automated report generation.
🎓 Join us on this analytics adventure and turn your raw data into a strategic asset with Power BI! 🌟
Key Takeaways:
- Understanding of Power BI's capabilities: Learn how to leverage Microsoft's powerful business intelligence tool.
- Data modeling and manipulation: Discover how to transform raw data into meaningful visualizations.
- Creating dashboards: Build custom, interactive dashboards for real-time data monitoring.
- Reporting insights: Generate comprehensive reports that provide deeper insights into your data.
- Collaboration and sharing: Learn best practices for working with team members and sharing insights across your organization.
- Security and compliance: Ensure your data remains secure while being accessible for analysis.
By the end of this course, you'll be able to confidently navigate Power BI's suite of tools, create compelling visualizations, and make data-driven decisions that can help steer your organization towards success. 💡
Enroll now and transform how you interact with data! 📈🚀
Course Gallery


Loading charts...