Microsoft Advanced Excel Dashboard : Zero To Hero (Complete)

Why take this course?
🌟 Master Advanced Excel Dashboards for Data Analytics! 🚀
Course Title: Microsoft Advanced Excel Dashboard: Zero To Hero (Complete)
Are you ready to transform the way you visualize and analyze data? Our comprehensive course, designed for professionals across all levels of their careers, from MIS executives to seasoned Data Analysts, will show you how to harness the full power of Microsoft Excel to create advanced dashboards that make complex scenarios clearer than ever.
📊 Why Choose This Course? Microsoft Excel is a game-changer for business users looking to analyze data and craft compelling reports and dashboards in a fraction of the time it would take with traditional spreadsheets. This course will guide you through creating captivating dashboards using an array of tools, functions, and macro scripts. Whether you're a beginner or an Excel pro, you'll find this course invaluable for enhancing your data visualization skills.
Course Highlights:
-
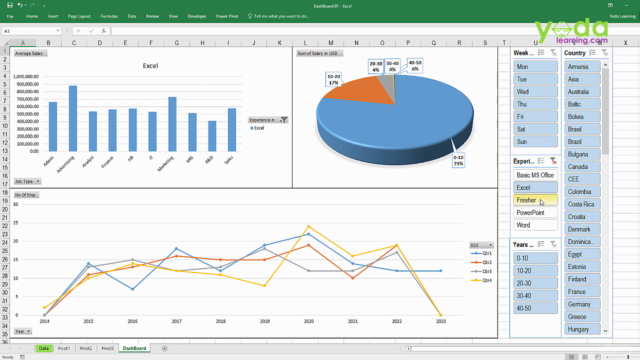
📈 Dashboards Using Pivot Tables: Master the art of creating dynamic dashboards with multiple and interlinked PivotTables, Slicer buttons, advanced charts, and more. You'll learn to:
- Utilize Text Functions for clear data naming and integration.
- Analyze data using Comparison Charts, Trend lines, Pie Charts from Slab Reports, and interactive Slicers with custom settings.
-
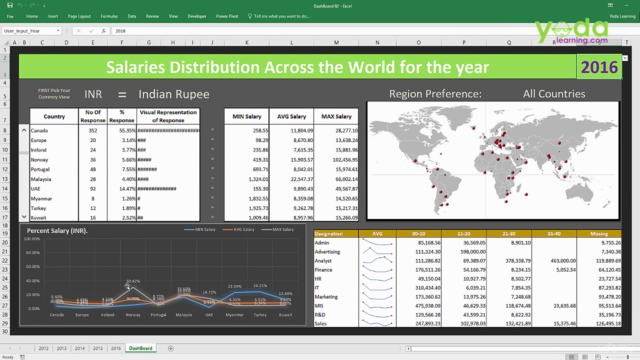
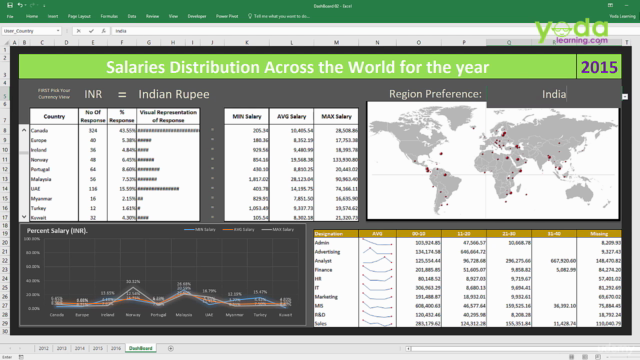
🧠 Dashboards Using Excel Functions: Dive into the world of importing data from the internet, converting line items to currency tables, performing complex calculations using INDEX & MATCH, and much more. You'll discover how to:
- Implement powerful functions like AverageIF for country-wise salary calculations.
- Use Dynamic Dropdowns and create longitude and latitude lists with data plotting on your dashboard.
- Leverage the REPT function for percentage calculations and perform advanced INDEX & MATCH operations with multiple references.
-
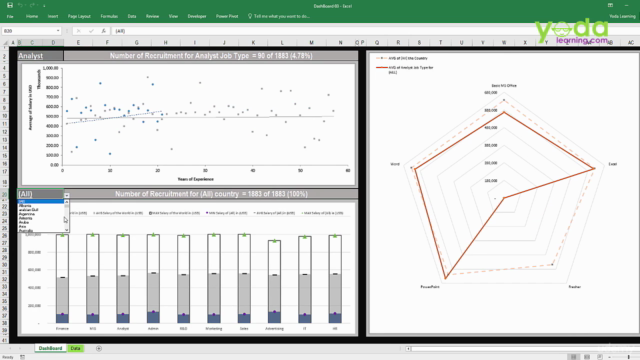
🛠️ Dashboards Using Excel Macros & Functions: Learn to automate tasks and enhance interactivity using macros, offset functions for dynamic data, and array functions like MAXIFS and MINIFS with single/multiple parameters. You'll also learn to prepare data for Spiderweb charts and adjust graph settings as needed.
What You Will Gain:
- A deep understanding of creating management reports using Excel 2010 and later versions.
- Skills to analyze and visualize data interactively with dashboards.
- Unlimited, lifetime access to the course material once enrolled.
- Free updates to the course content as new features are added.
- Full support from the instructor for any course-related issues or suggestions.
- 24x7 access to all videos, allowing you to learn online anytime, anywhere.
- A 30-day money-back guarantee to ensure your complete satisfaction.
🚀 Take Action Now! Don't let this opportunity pass you by. Invest just 4 hours now and elevate your skillset for a lifetime with Advanced Excel Dashboard Mastery. Join today and transform into an Excel Ninja, ready to tackle any data challenge with confidence and precision. 💻💪
Enroll now and step into the world of advanced data analytics with Microsoft Excel!
Course Gallery


Loading charts...