Microsoft Excel: Advanced Dashboard Design (Project-Based!)

Why take this course?
🌟 Microsoft Excel Mastery Awaits You! 🌟
Course Title:
Mastering Microsoft Excel: Data Visualization & Dashboard Design
Course Headline:
Unlock Your Analytical Potential with Pro-Quality Excel Dashboards!
Course Description:
This hands-on, project-based course is meticulously designed to elevate your analytics, data visualization, and storytelling skills to expert levels using Microsoft Excel. With a focus on creating dynamic, interactive reports and dashboards, you'll learn powerful techniques that will transform the way you handle data.
📈 Key Topics Covered:
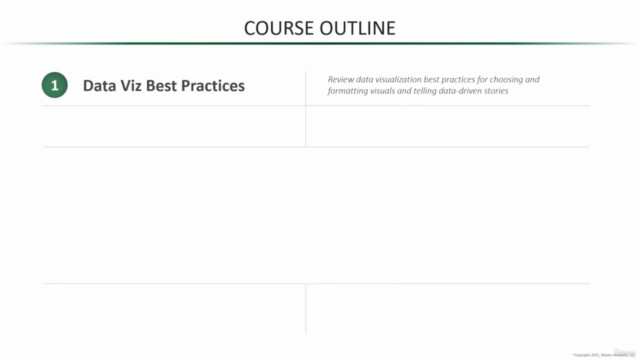
- Data Visualization Best Practices: Learn how to select the right visuals, eliminate clutter, and tell compelling data-driven stories.
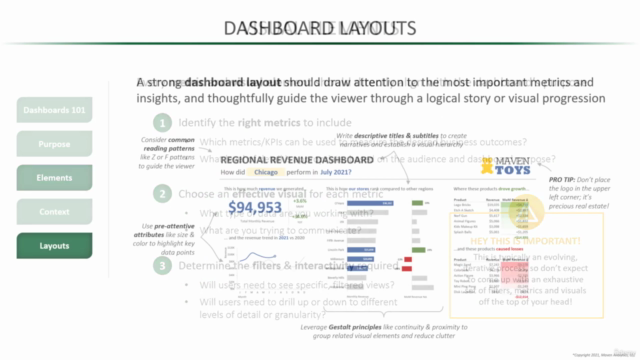
- Dashboard Design Principles: Gain insights into defining clear objectives, identifying effective metrics and visual elements, and mastering layout and flow with principles like reading patterns and Gestalt.
Your Learning Journey:
Throughout the course, you will immerse yourself in a series of unique, real-world projects:
- 🎶 Maven Music: Explore the evolution of the music industry and its transition to digital formats.
- 💼 Maven Careers: Analyze salary and employment data across key industries in the US.
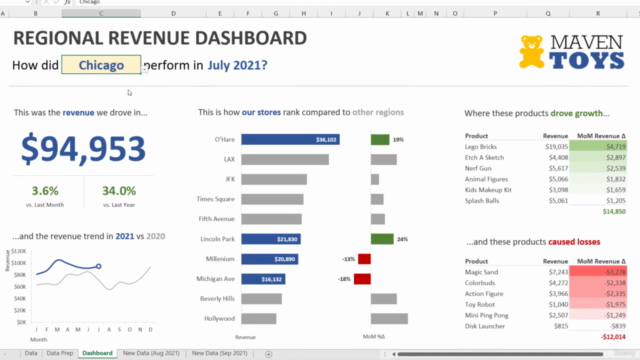
- 🧸 Maven Toys: Design a KPI dashboard for sales managers to track regional performance.
- 🏨 Maven Hotel Group: Visualize hotel booking data, uncovering key cancellation patterns and business insights.
What You'll Achieve:
- Create professional-quality MS Excel dashboards that will stand out in your portfolio.
- Gain the knowledge and confidence to apply these skills to any spreadsheet or dataset.
Course Offerings:
Join this course today and get immediate, lifetime access to:
- 🎬 6+ hours of high-quality video instruction.
- 📖 Dashboard Design PDF ebook.
- 💾 Downloadable Excel project files & solutions.
- 🤔 Expert support and Q&A forum to help you through your learning journey.
- 💰 30-day money-back guarantee for your peace of mind.
Special Offer:
Dive into our full course library with Maven Analytics to explore our offerings in Excel, Power BI, SQL, Tableau, Python, Alteryx, and Machine Learning!
Student Testimonials:
🏆 "At the first part I just said to myself, 'Wow, Excel is capable of that? It's amazing!' Then at the second part I told myself 'This guy is doing magic!', and now I feel like I'm capable of doing the same. I can't wait to dive into the other courses!" - Judit B.
🏆 "Excellent from start to finish. I picked up a bunch of techniques that will be useful in the workplace, from new chart templates to some very cool advanced visualizations. I loved all of it!" - Robert C.
🏆 "Excellent material that I apply to my daily use of Excel. I consider myself an Excel professional, yet I picked up dozens of new tips and techniques. Wonderful course, well-presented and well-explained." - Jeffrey P.
Embark on your journey to becoming an Excel wizard today! 🚀 Your analytical masterpiece awaits. Enroll now and transform the way you interact with data tomorrow!
Course Gallery


Loading charts...
Comidoc Review
Our Verdict
Unleash your creativity in data visualization while enhancing professional-quality dashboard design skills specific to MS Excel. This Maven Analytics course, led by Enrique Ruiz, offers actionable insights through engaging projects that cater to learners at various expertise levels. While there's room for more emphasis on data preparation and foundational concepts, the practical applications and flexibility in dashboard creation make this a valuable addition to your e-learning journey.
What We Liked
- Brimming with practical applications of data visualization concepts and storytelling principles
- In-depth coverage of formula-based dashboard design provides greater flexibility compared to pivot tables
- Highly applicable to various tools like PowerBI, Tableau, and others, expanding its overall value
- Excellent blend of hands-on course projects, enabling students to immediately apply new skills in Excel
Potential Drawbacks
- Some users might prefer more focus on data preparation and analysis
- May assume some prior experience with Excel functions and graphs
- A smaller number of students expressed a desire for more complex dashboard examples