Microsoft Excel: Data Visualization w/ Excel Charts & Graphs

Why take this course?
🚀 Master Microsoft Excel: Data Visualization, Excel Charts & Graphs 📊
Course Headline:
Master 20+ Excel charts, build advanced Excel visuals & learn data analysis with a best-selling Excel instructor!
Course Description:
Excel isn't just for basic calculations; it's a dynamic data visualization platform that can turn numbers into compelling stories. 📈✨ And I, Chris from Maven Analytics, am here to show you the full potential of Excel beyond the basics!
🔍 Dive Deep into Excel's Latest Visualization Tools: This course offers a comprehensive understanding of all the latest Excel chart types and data visualization techniques. You'll learn when, why, and how to use each tool effectively, with a focus on real-world applications and best practices. 📚✨
🎨 Explore a Vast Array of Chart Types: From the basics like bar charts and line graphs to advanced visuals like custom gauge charts and pacing charts, you'll explore 20+ chart types, each with its unique applications. You'll also master formatting and customization to make your data pop! 🎨💡
🚀 Advanced Excel Skills for Your Arsenal: Ready to take your Excel game to the next level? This course covers everything from creating complex grid visuals using array formulas to enhancing your charts with conditional formatting. You'll learn how to analyze data like a pro and visualize it in ways that will captivate your audience! 🚀📊
👍 Practical Learning with Real-World Examples: With hands-on projects and real-world examples, you'll not only understand the concepts but also see how they apply to business intelligence scenarios. You'll be equipped with the skills to analyze data and present it in a way that is both informative and visually appealing. 🌐🔍
🔥 Includes Exclusive Resources: The full course comes with downloadable resources, project files, homework, quizzes, and lifetime access—all designed to help you master Excel's data visualization capabilities. Plus, with a 30-day money-back guarantee, there's no risk in taking your skills to the next level! 🎓🔥
🏆 Top-Rated Course on Udemy: Don't just take our word for it—this course is rated top among Excel courses on Udemy! With glowing reviews from students who have transformed their data visualization skills, you can be confident that you're getting a quality learning experience. 🏆💪
🤝 Join the Maven Analytics Community: Looking to expand your skill set even further? Search for "Maven Analytics" on Udemy to find our full course library, which includes Excel, Power BI, MySQL, Python, and Tableau courses. Join a community of learners who are advancing their data analysis and business intelligence skills every day! 🤝📚
🔗 Explore More:
🎓 Ready to Elevate Your Data Visualization Skills in Excel? Enroll now and transform the way you analyze and present data with Microsoft Excel! 🎉🚀
Note: The course includes downloadable resources, project files, homework, and quizzes for a comprehensive learning experience. Lifetime access and a 30-day money-back guarantee ensure that your investment in learning is risk-free. Most lectures are compatible with Excel 2016, Excel 2019, and Office 365.
Course Gallery


Loading charts...
Comidoc Review
Our Verdict
Microsoft Excel: Data Visualization with Excel Charts & Graphs earns a strong recommendation for Excel users seeking a deep dive into chart applications. While worked examples could be expanded and regional formula settings addressed, the course offers valuable insights, practical exercises, and future access to updated content. Keep learning pace in mind when considering enrollment.
What We Liked
- Comprehensive exploration of 20+ Excel chart types, enabling effective data visualization
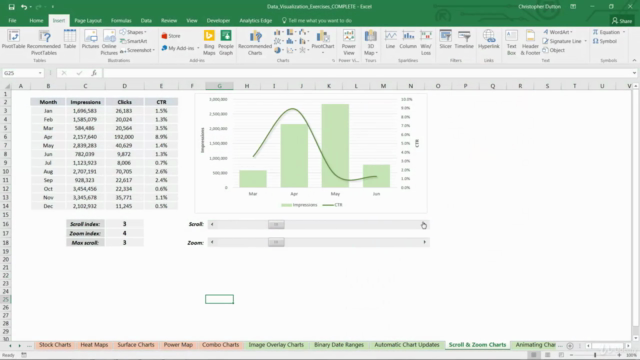
- Insights into advanced Excel tools like automated dashboards and scrolling charts
- Detailed project files, quizzes, and exercises for hands-on practice
- Lifetime access to course updates, reflecting the latest in Excel technology
Potential Drawbacks
- Some areas could benefit from more worked examples to cater to varied learning styles
- Clarification needed on handling regional formula differences, enhancing user experience
- Pacing may challenge beginners; prior basic knowledge of formulas and graphs recommended