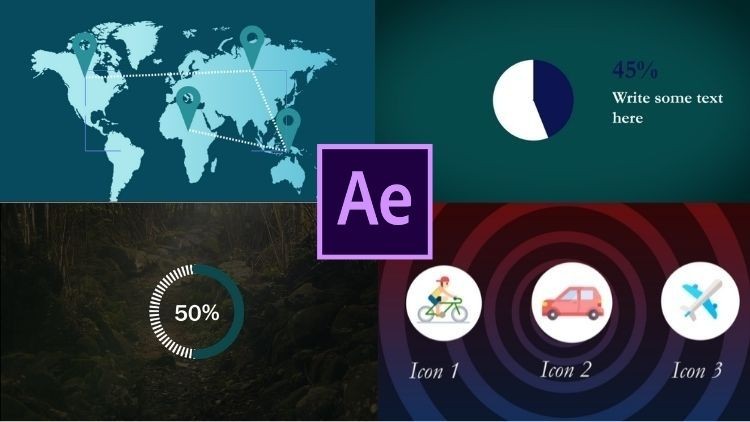
Adobe After Effects: Infographics & data visualization

Why take this course?
🎉 Master Adobe After Effects for Infographics & Data Visualization! 🚀
Hello, Future Data Storyteller!
My name is Nshuti Paulin, and I'm here to guide you through the magical world of motion graphics with a focus on creating compelling infographics and data visualizations using Adobe After Effects. 🎨🔬
Whether you're a complete beginner or looking to sharpen your skills, this Adobe After Effects: Infographics & Data Visualization course is tailored just for you! We'll embark on an exciting journey from the basics to advanced techniques, transforming static data into dynamic and engaging stories.
Why Take This Course?
- No Prior Experience Necessary: You don't need any background in VFX Compositing or motion graphics in After Effects to join this course. We'll start from the ground up! 🛠️
- Step-by-Step Learning: From animating simple icons to creating beautiful gradient backgrounds, I'll walk you through each step with clear and easy-to-follow instructions.
- Comprehensive Coverage: We'll dive into:
- Setting up your After Effects project for infographics.
- Adding and animating backgrounds and icons.
- Finding free icons, graphics, and music to enhance your projects.
- Techniques like Motion Blur, Overshoot animation, and text animation.
- Incorporating sound effects for a more immersive experience.
- Crafting gradient and seamless backgrounds.
- Analyzing data with pie charts and visualizing global trends with animated world maps.
- Hands-On Projects: Each concept will be reinforced with practical exercises that you can incorporate into your own infographics projects.
- Support Along the Way: I'll be here to assist you every step of the way, answering your questions in the 'Questions and Answers' video comments section. 💬
Course Highlights:
- Project Setup: Learn how to efficiently organize your After Effects workspace for infographic projects.
- Background Magic: Discover how to add and animate beautiful backgrounds to set the scene for your data storytelling.
- Icon Animation: Bring static icons to life with easy-to-master animation techniques.
- Motion Blur & Overshoot: Enhance your animations with professional effects that make your visuals pop.
- Text Animation: Learn the art of storytelling with text, guiding viewers through your data.
- Sound Design: Add the perfect sound to complement your animation and captivate your audience.
- Gradient & Seamless Backgrounds: Create visually appealing backgrounds that add depth and interest to your work.
- Infographic Integration: Combine charts, maps, and graphics with your animated backgrounds for a cohesive story.
- Rendering Mastery: Understand the ins and outs of rendering in After Effects and Adobe Media Encoder, ensuring your final pieces are ready for any platform or audience.
- Creating Animated GIFs: Share your work with the world by creating animated GIFs that can be used across social media and online platforms.
Ready to Dive In? 🌊
Enroll in this course today and start your journey into the exciting field of infographics and data visualization with After Effects. Let's turn complex data into captivating stories that engage and inform! 🎉
See you inside the course, Nshuti Paulin
Loading charts...